Delta Dashboard with Custom Candle Count "Delta Dashboard with Custom Candle Count," creates a dynamic table on a chart that shows Buying Delta, Selling Delta, and Cumulative Delta for a user-defined number of candles. It is designed to give traders an easy-to-read visual dashboard for analyzing volume-based deltas, potentially helping to identify bullish or bearish trends.
Script Overview:
Custom Timeframe Input: The user has the option to enable a custom lower timeframe (useCustomTimeframeInput). If enabled, the script uses the lowerTimeframeInput (default is 1 minute) to request data from a lower timeframe. If not enabled, the script automatically selects a timeframe based on the chart’s current settings.
Candle Count Input: The script allows the user to specify the number of candles (numCandlesInput) for which they want to track volume deltas. This input determines how many columns are included in the delta dashboard.
Proportional Buy/Sell Volume Calculation: The script calculates the buy and sell volume for each candle. The buy volume is based on how much the price has moved up from the low, while the sell volume is based on how much the price has moved down from the high. The total volume is then split between buyers and sellers for a more accurate volume-based analysis.
Lower Timeframe Volume Data: The script requests volume data from the lower timeframe and uses it to calculate the positive (buying) and negative (selling) volume arrays over the specified number of candles.
Cumulative Delta: The cumulative delta is calculated as the difference between buying volume (positiveVolume) and selling volume (negativeVolume). The delta is accumulated over the day, and it resets at the start of each new day.
Dashboard Creation: The script creates a table (deltaTable) that is displayed on the chart, showing the following for each candle:
Buying Delta: The volume of buy orders.
Selling Delta: The volume of sell orders.
Cumulative Delta: The net difference between buying and selling volumes over the course of the day.
Dynamic Table Updating: The table updates with each new candle. The current candle's data is dynamically added to the table, and older candles shift to the left. When the maximum number of candles (as defined by numCandlesInput) is reached, the table wraps around, continuously updating with the latest data.
Abnormal Volume Detection: The script highlights candles where abnormal volume is detected. If the buying or selling volume for a particular candle is greater than twice the 50-period moving average volume, it highlights the respective cells in the table with shaded background colors:
Green: Indicates abnormal buying volume.
Red: Indicates abnormal selling volume.
Blue: Highlights abnormal cumulative delta spikes.
Daily Reset: The script automatically clears the table at the start of each new day, ensuring that the dashboard only reflects data from the current trading day.
How to Use:
Adding to Chart: To use this script, apply it to your TradingView chart. The dashboard will automatically appear in the upper left corner of the chart, showing volume-based delta data for each candle.
Customizing Timeframe: If you want to use a different timeframe for delta calculation (e.g., 1-second or 1-minute chart data), enable the Use Custom Timeframe option and specify the desired timeframe in the input section.
Adjusting the Number of Candles: You can adjust the number of candles shown in the delta dashboard by changing the Number of Candles input. The script will track the volume deltas for this number of candles, displaying them in the dashboard.
Interpreting the Dashboard:
Buying Delta: A higher positive value indicates stronger buying pressure in that candle.
Selling Delta: A higher negative value indicates stronger selling pressure in that candle.
Cumulative Delta: This value gives the net result of buying versus selling pressure across the trading day. Positive cumulative delta suggests buying dominance, while negative cumulative delta suggests selling dominance.
Abnormal Volume Detection: When abnormal volume spikes occur, pay attention to highlighted rows:
Green cells show that buying volume is unusually high.
Red cells indicate unusually high selling volume.
Blue cells mark large spikes in cumulative delta.
This script can be particularly useful for traders who want to gauge market sentiment based on volume distribution and detect abnormal trading activity, which could precede significant price movements.
스크립트에서 "VOLUME DELTA"에 대해 찾기

Up/Down Volume with Table (High Contrast)Up/Down Volume with Table (High Contrast) — Script Summary & User Guide
Purpose of the Script
This TradingView indicator, Up/Down Volume with Table (High Contrast), visually separates and quantifies up-volume and down-volume for each bar, providing both a color-coded histogram and a dynamic table summarizing the last five bars. The indicator helps traders quickly assess buying and selling pressure, recent volume shifts, and their relationship to price changes, all in a highly readable format.
Key Features
Up/Down Volume Columns:
Green columns represent volume on bars where price closed higher than the previous bar (up volume).
Red columns represent volume on bars where price closed lower than the previous bar (down volume).
Delta Line:
Plots the net difference between up and down volume for each bar.
Green when up-volume exceeds down-volume; red when down-volume dominates.
Interactive Table:
Displays the last five bars, showing up-volume, down-volume, delta, and close price.
Color-coding for quick interpretation.
Table position, decimal places, and timeframe are all user-configurable.
Custom Timeframe Support:
Calculate all values on the chart’s timeframe or a custom timeframe of your choice (e.g., daily, hourly).
High-Contrast Design:
Table and plot colors are chosen for maximum clarity and accessibility.
User Inputs & Configuration
Use custom timeframe:
Toggle between the chart’s timeframe and a user-specified timeframe.
Custom timeframe:
Set the timeframe for calculations if custom mode is enabled (e.g., "D" for daily, "60" for 60 minutes).
Decimal Places:
Choose how many decimal places to display in the table.
Table Location:
Select where the table appears on your chart (e.g., Bottom Right, Top Left, etc.).
How to Use
Add the Script to Your Chart:
Copy and paste the code into a new Pine Script indicator on TradingView.
Add the indicator to your chart.
Configure Inputs:
Open the indicator settings.
Adjust the timeframe, decimal places, and table location as desired.
Read the Table:
The table appears on your chart (location is user-selectable) and displays the following for the last five bars:
Bar: "Now" for the current bar, then "Bar -1", "Bar -2", etc. for previous bars.
Up Vol: Volume on bars where price closed higher than previous bar, shown in black text.
Down Vol: Volume on bars where price closed lower than previous bar, shown in black text.
Delta: Up Vol minus Down Vol, colored green for positive, red for negative, black for zero.
Close: Closing price for each bar, colored green if price increased from previous bar, red if decreased, black if unchanged.
Interpret the Histogram and Lines:
Green Columns:
Represent up-volume. Tall columns indicate strong buying volume.
Red Columns:
Represent down-volume. Tall columns indicate strong selling volume.
Delta Line:
Plotted as a line (not a column), colored green for positive values (more up-volume), red for negative (more down-volume).
Large positive or negative spikes may indicate strong buying or selling pressure, respectively.
How to Interpret the Table
Column Meaning Color Coding
Bar "Now" (current bar), "Bar -1" (previous bar), etc. Black text
Up Vol Volume for bars with higher closes than previous bar Black text
Down Vol Volume for bars with lower closes than previous bar Black text
Delta Up Vol - Down Vol. Green if positive, red if negative, black if zero Green/Red/Black
Close Closing price for the bar. Green if price increased, red if decreased, black if unchanged Green/Red/Black
Green Delta: Indicates net buying pressure for that bar.
Red Delta: Indicates net selling pressure for that bar.
Close Price Color:
Green: Price increased from previous bar.
Red: Price decreased.
Black: No change.
Practical Trading Insights
Consistently Green Delta (Histogram & Table):
Sustained buying pressure; may indicate bullish sentiment or accumulation.
Consistently Red Delta:
Sustained selling pressure; may indicate bearish sentiment or distribution.
Large Up/Down Volume Spikes:
Big green or red columns can signal strong market activity or potential reversals if they occur at trend extremes.
Delta Flipping Colors:
Rapid alternation between green and red deltas may indicate a choppy or indecisive market.
Close Price Color in Table:
Use as a quick confirmation of whether volume surges are pushing price in the expected direction.
Troubleshooting & Notes
No Volume Data Error:
If your symbol doesn’t provide volume data (e.g., some indices or synthetic assets), the script will display an error.
Custom Timeframe:
If using a custom timeframe, ensure your chart supports it and that there is enough data for meaningful calculations.
High-Contrast Table:
Designed for clarity and accessibility, but you can adjust colors in the code if needed for your personal preferences.
Summary Table Legend
Bar Up Vol Down Vol Delta Close
Now ... ... ... ...
Bar-1 ... ... ... ...
... ... ... ... ...
Colors reflect the meaning as described above.
In Summary
This indicator visually and numerically breaks down buying and selling volume, helping you spot shifts in market sentiment, volume surges, and price/volume divergences at a glance.
Use the table for precise recent data, the histogram for overall flow, and the color cues for instant market context.

Periodic Activity Tracker [LuxAlgo]The Periodic Activity Tracker tool periodically tracks the cumulative buy and sell volume in a user-defined period and draws the corresponding matching bars and volume delta for each period.
Users can select a predefined aggregation period from the following options: Hourly, Daily, Weekly, and Monthly.
🔶 USAGE
This tool provides a simple and clear way of analyzing volumes for each aggregated period and is made up of the following elements:
Buy and sell volumes by period as red and green lines with color gradient area
Delta (difference) between buy & sell volume for each period
Buy & sell volume bars for each period
Separator between lines and bars, and period tags below each pair of bars for ease of reading
On the chart above we can see all the elements displayed, the volume level on the lines perfectly matches the volume level on the bars for each period.
In this case, the tool has the default settings so the anchor period is set to Daily and we can see how the period tag (each day of the week) is displayed below each pair of bars.
Users can disable the delta display and adjust the bar size.
🔹 Reading The Tool
In trading, assessing the strength of the bulls (buyers) and bears (sellers) is key to understanding the current trading environment. Which side, if any, has the upper hand? To answer this question, some traders look at volume in relation to price.
This tool provides you with a view of buy volume versus sell volume, allowing you to compare both sides of the market.
As with any volume tool, the key is to understand when the forces of the two groups are balanced or unbalanced.
As we can observe on the chart:
NOV '23: Buy volume greater than sell volume, both moving up close together, flat delta. We can see that the price is in range.
DEC '23: Buy volume bigger than Sell volume, both moving up but with a bigger difference, bigger delta than last month but still flat. We can see the price in the range above last month's range.
JAN '24: Buy and sell volume tied together, no delta whatsoever. We can see the price in range but testing above and below last month's range.
FEB '24: Buy volume explodes higher and sell volume cannot keep up, big growing delta. Price explodes higher above last month's range.
Traders need to understand that there is always an equal number of buyers and sellers in a liquid market, the quality here is how aggressive or passive they are. Who is 'attacking' and who is 'defending', who is using market orders to move prices, and who is using limit orders waiting to be filled?
This tool gives you the following information:
Lines: if the top line is green, the buyers are attacking, if it is red, the sellers are attacking.
Delta: represents the difference in their strength, if it is above 0 the buyers are stronger, if it is below 0 the sellers are stronger.
Bars: help you to see the difference in strength between buyers and sellers for each period at a glance.
🔹 Anchor Period
By default, the tool is set to Hourly. However, users can select from a number of predefined time periods.
Depending on the user's selection, the bars are displayed as follows:
Hourly : hours of the current day
Daily : days of the current week
Weekly : weeks of the current month
Monthly : months of the current year
On the chart above we can see the four periods displayed, starting at the top left and moving clockwise we have hourly, daily, weekly, and monthly.
🔶 DETAILS
🔹 Chart TimeFrame
The chart timeframe has a direct impact on the visualization of the tool, and the user should select a chart timeframe that is compatible with the Anchor period in the tool's settings panel.
For the chart timeframe to be compatible it must be less than the Anchor period parameter. If the user selects an incompatible chart timeframe, a warning message will be displayed.
As a rule of thumb, the smaller the chart timeframe, the more data the tool will collect, returning indications for longer-term price variations.
These are the recommended chart timeframes for each period:
Hourly : 5m charts or lower
Daily : 1H charts or lower
Weekly : 4H charts or lower
Monthly : 1D charts or lower
🔹 Warnings
This chart shows both types of warnings the user may receive
At the top, we can see the warning that is given when the 'Bar Width' parameter exceeds the allowed value.
At the bottom is the incompatible chart timeframe warning, which prompts the user to select a smaller chart timeframe or a larger "Anchor Period" parameter.
🔶 SETTINGS
🔹 Data Gathering
Anchor period: Time period representing each bar: hours of the day, days of the week, weeks of the month, and months of the year. The timeframe of the chart must be less than this parameter, otherwise a warning will be displayed.
🔹 Style
Bars width: Size of each bar, there is a maximum limit so a warning will be displayed if it is reached.
Volume color
Delta: Enable/Disable Delta Area Display

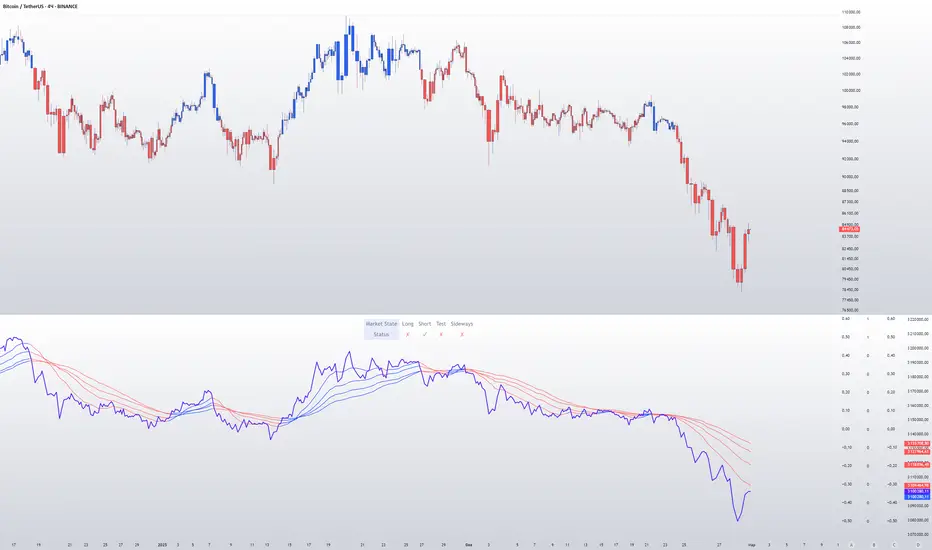
CVD with Moving Average (Trend Colors) [SYNC & TRADE]Yesterday I wrote a simple and easy code for the indicator "Cumulative Delta Volume with a moving average" using AI.
Introduction:
Delta is the difference between buys and sells. If there are more purchases, the delta is positive, if there are more sales, the delta is negative. We look at each candle separately on a particular time frame, which does not give us an overall picture over time.
Cumulative volume delta is in many ways an extension of volume delta, but it covers longer periods of time and provides different trading signals. Like the volume delta indicator, the Cumulative Volume Delta (CVD) indicator measures the relationship between buying and selling pressure, but does not focus on one specific candle (or other chart element), but rather gives a picture over time.
What did you want to get?
I have often seen that they tried to attach RSI and the Ichimoku cloud to the cumulative delta of volume, but I have never seen a cumulative delta of volume with a moving average. A moving average that takes data from the cumulative volume delta will be different from the moving average of the underlying asset. It has been noted that often at the intersection of the cumulative volume delta and the moving average, this is a more accurate signal to buy or sell than the same intersections for the underlying asset.
Initially, 5 moving averages were made with values of 21, 55, 89, 144 and 233, but I realized that this overloads the chart. It is easier to change the length of the moving average depending on the time frame you are using than to overload the chart. The final version with one moving SMA, EMA, RMA, WMA, HMA.
The logic for applying a moving average to a cumulative volume delta:
You choose a moving average, just like you would on your underlying asset. Use the moving average you like and the period you are used to working with. Each TF has its own settings.
What we see on the graph:
This is not an oscillator, but an adapted version for a candlestick chart (line only). Using it, you can clearly see where the market is moving based on the cumulative volume delta. The cool thing is that you can include your moving average applied to the cumulative volume delta. Thanks to this, you can see a trend movement, a return to the moving average to continue the trend.
Opportunities not lost:
The most interesting thing is that it remains possible to observe the divergence of the asset and the cumulative delta of the volume. This gives a great advantage. Those who have not worked with divergence do not rush into it right away. There may be 3 peaks in divergence (as with oversold/overbought), but it works many times more clearly than RSI and MACD.
Here's a good example on the daily chart. The moment we were all waiting for 75,000. The cumulative Delta Volume fell with each peak, while the price chart (tops) were approximately level.
Usually they throw (allow to buy) without volume for sales (delta down, price up) in order to merge at a more interesting price. And they also drain without the volume of purchases for a squeeze (price down / delta up) and again I buy back at a more interesting price. There are more complex estimation options; you can read about the divergence of the cumulative delta of the CVD volume. I just recommend doing a backtest.
Recommendations:
One more moment. Use the indicator on the stock exchange, where there is the most money, by turnover and by asset. Choose Binance, not Bybit. Those. choose the BTC asset, for example, but on the Binance exchange. Not futures, but spot.
The greater the turnover on the exchange for an asset, and the fewer opportunities to enter with leverage, the less volatile the price and the more beautiful and accurate the chart.
Works on all assets. There is a subscription limit (the number of calculated bars) that has little effect on anything. Can be applied to any asset where there is volume (not SPX, but ES1, not MOEX, but MX1!).
Перевод на русский.
Вчера написал с помощью AI простой и легкий код индикатора "Кумулятивная Дельта Объема со скользящей средней".
Введение:
Дельта (Delta) — это разница между покупками и продажами. Если покупок больше — дельта положительная, если больше продаж — дельта отрицательная. Мы смотрим на каждую свечу отдельно на том или ином таймфрейме, что не дает нам общей картины во времени.
Кумулятивная дельта объема — во многом продолжение дельты объёмов, но она включает более длительные периоды времени и дает другие торговые сигналы. Как и индикатор дельты объёма, индикатор кумулятивной дельты объема (Cumulative Volume Delta, CVD) измеряет связь между давлением покупателей и продавцов, но при этом не фокусируется на одной конкретной свече (или другом элементе графика), а дает картину во времени.
Что хотел получить?
Часто видел, что к кумулятивной детьте объема пытались прикрепить RSI и облако ишимоку, но никогда не видел кумулятивную дельту объема со скользящей средней. Скользящая средняя которая берет данные от кумулятивной дельты объема будет отличатся от скользящей средней основного актива. Было замечено, что часто в местах пересечения кумулятивной дельты объема и скользящей средней - это более точный сигнал к покупке или продаже, чем такие же пересечения по основному активу.
Изначально было сделанно 5 скользящих со значениями 21, 55, 89, 144 и 233, но я понял, что это перегружает график. Проще менять длину скользящей средней от используемого таймфрейма, чем перегружать график. Финальный вариант с одной скользящей SMA, EMA, RMA, WMA, HMA.
Логика применения скользящей средней к кумулятивной дельте объема:
Вы выбираете скользящую среднюю, так же как и на основном активе. Применяйте ту скользящую среднюю, которая вам нравится и период, с которым привыкли работать. На каждом TF свои настройки.
Что мы видим на графике:
Это не осциллятор, а адаптированная версия к свечному графику (только линия). С помощью него вы можете наглядно посмотреть куда движется рынок по кумулятивной дельте объема. Самое интересное, что вы можете включить свою скользящую среднюю, применимую к кумулятивной дельте объема. Благодаря этому вы можете видеть трендовое движение, возврат к средней скользящей для продолжения тренда.
Не потерянные возможности:
Самое интересное, что осталась возможность наблюдать за дивергенцией актива и кумулятивной дельтой объема. Это дает большое преимущество. Те кто не работал с дивергенцией не бросайтесь на нее сразу. Может быть и 3 пика в дивергенции (как с перепроданностью / перекупленностью), но работает в разы четче чем RSI и MACD.
Вот хороший пример на дневном графике. Момент когда мы все ждали 75000. Кумулятивная Дельта Объема падала с каждым пиком, в то время как ценовой график (вершины) были примерно на уровне.
Обычно закидывают (разрешают покупать) без объема на продажи (дельта вниз цена вверх), чтобы слить по более интересной цене. И также сливают без объема покупок для сквиза (цена вниз / дельта вверх) и опять откупаю по более интересной цене. Существуют более сложные варианты оценки, можете почитать про дивергенцию кумулятивной дельты объема CVD. Только рекомендую сделать бэктест.
Рекомендации:
Еще момент. Используйте индикатор, на бирже, там где больше всего денег, по обороту и по активу. Выбирайте не Bybit, а Binance. Т.е. выбираете актив BTC, к примеру, но на бирже Binance. Не фьючерс, а спот.
Чем более большие обороты на бирже, по активу, и меньше возможностей заходить с плечами, тем менее волатильная цена и более красивый и точный график.
Работает на всех активах. Есть ограничение по подписке (количество рассчитываемых баров) мало влияет на что. Можно применить к любому активу где есть объем (не SPX, а ES1, не MOEX, а MX1!).
ATAI Volume analysis with price action V 1.00ATAI Volume Analysis with Price Action
1. Introduction
1.1 Overview
ATAI Volume Analysis with Price Action is a composite indicator designed for TradingView. It combines per‑side volume data —that is, how much buying and selling occurs during each bar—with standard price‑structure elements such as swings, trend lines and support/resistance. By blending these elements the script aims to help a trader understand which side is in control, whether a breakout is genuine, when markets are potentially exhausted and where liquidity providers might be active.
The indicator is built around TradingView’s up/down volume feed accessed via the TradingView/ta/10 library. The following excerpt from the script illustrates how this feed is configured:
import TradingView/ta/10 as tvta
// Determine lower timeframe string based on user choice and chart resolution
string lower_tf_breakout = use_custom_tf_input ? custom_tf_input :
timeframe.isseconds ? "1S" :
timeframe.isintraday ? "1" :
timeframe.isdaily ? "5" : "60"
// Request up/down volume (both positive)
= tvta.requestUpAndDownVolume(lower_tf_breakout)
Lower‑timeframe selection. If you do not specify a custom lower timeframe, the script chooses a default based on your chart resolution: 1 second for second charts, 1 minute for intraday charts, 5 minutes for daily charts and 60 minutes for anything longer. Smaller intervals provide a more precise view of buyer and seller flow but cover fewer bars. Larger intervals cover more history at the cost of granularity.
Tick vs. time bars. Many trading platforms offer a tick / intrabar calculation mode that updates an indicator on every trade rather than only on bar close. Turning on one‑tick calculation will give the most accurate split between buy and sell volume on the current bar, but it typically reduces the amount of historical data available. For the highest fidelity in live trading you can enable this mode; for studying longer histories you might prefer to disable it. When volume data is completely unavailable (some instruments and crypto pairs), all modules that rely on it will remain silent and only the price‑structure backbone will operate.
Figure caption, Each panel shows the indicator’s info table for a different volume sampling interval. In the left chart, the parentheses “(5)” beside the buy‑volume figure denote that the script is aggregating volume over five‑minute bars; the center chart uses “(1)” for one‑minute bars; and the right chart uses “(1T)” for a one‑tick interval. These notations tell you which lower timeframe is driving the volume calculations. Shorter intervals such as 1 minute or 1 tick provide finer detail on buyer and seller flow, but they cover fewer bars; longer intervals like five‑minute bars smooth the data and give more history.
Figure caption, The values in parentheses inside the info table come directly from the Breakout — Settings. The first row shows the custom lower-timeframe used for volume calculations (e.g., “(1)”, “(5)”, or “(1T)”)
2. Price‑Structure Backbone
Even without volume, the indicator draws structural features that underpin all other modules. These features are always on and serve as the reference levels for subsequent calculations.
2.1 What it draws
• Pivots: Swing highs and lows are detected using the pivot_left_input and pivot_right_input settings. A pivot high is identified when the high recorded pivot_right_input bars ago exceeds the highs of the preceding pivot_left_input bars and is also higher than (or equal to) the highs of the subsequent pivot_right_input bars; pivot lows follow the inverse logic. The indicator retains only a fixed number of such pivot points per side, as defined by point_count_input, discarding the oldest ones when the limit is exceeded.
• Trend lines: For each side, the indicator connects the earliest stored pivot and the most recent pivot (oldest high to newest high, and oldest low to newest low). When a new pivot is added or an old one drops out of the lookback window, the line’s endpoints—and therefore its slope—are recalculated accordingly.
• Horizontal support/resistance: The highest high and lowest low within the lookback window defined by length_input are plotted as horizontal dashed lines. These serve as short‑term support and resistance levels.
• Ranked labels: If showPivotLabels is enabled the indicator prints labels such as “HH1”, “HH2”, “LL1” and “LL2” near each pivot. The ranking is determined by comparing the price of each stored pivot: HH1 is the highest high, HH2 is the second highest, and so on; LL1 is the lowest low, LL2 is the second lowest. In the case of equal prices the newer pivot gets the better rank. Labels are offset from price using ½ × ATR × label_atr_multiplier, with the ATR length defined by label_atr_len_input. A dotted connector links each label to the candle’s wick.
2.2 Key settings
• length_input: Window length for finding the highest and lowest values and for determining trend line endpoints. A larger value considers more history and will generate longer trend lines and S/R levels.
• pivot_left_input, pivot_right_input: Strictness of swing confirmation. Higher values require more bars on either side to form a pivot; lower values create more pivots but may include minor swings.
• point_count_input: How many pivots are kept in memory on each side. When new pivots exceed this number the oldest ones are discarded.
• label_atr_len_input and label_atr_multiplier: Determine how far pivot labels are offset from the bar using ATR. Increasing the multiplier moves labels further away from price.
• Styling inputs for trend lines, horizontal lines and labels (color, width and line style).
Figure caption, The chart illustrates how the indicator’s price‑structure backbone operates. In this daily example, the script scans for bars where the high (or low) pivot_right_input bars back is higher (or lower) than the preceding pivot_left_input bars and higher or lower than the subsequent pivot_right_input bars; only those bars are marked as pivots.
These pivot points are stored and ranked: the highest high is labelled “HH1”, the second‑highest “HH2”, and so on, while lows are marked “LL1”, “LL2”, etc. Each label is offset from the price by half of an ATR‑based distance to keep the chart clear, and a dotted connector links the label to the actual candle.
The red diagonal line connects the earliest and latest stored high pivots, and the green line does the same for low pivots; when a new pivot is added or an old one drops out of the lookback window, the end‑points and slopes adjust accordingly. Dashed horizontal lines mark the highest high and lowest low within the current lookback window, providing visual support and resistance levels. Together, these elements form the structural backbone that other modules reference, even when volume data is unavailable.
3. Breakout Module
3.1 Concept
This module confirms that a price break beyond a recent high or low is supported by a genuine shift in buying or selling pressure. It requires price to clear the highest high (“HH1”) or lowest low (“LL1”) and, simultaneously, that the winning side shows a significant volume spike, dominance and ranking. Only when all volume and price conditions pass is a breakout labelled.
3.2 Inputs
• lookback_break_input : This controls the number of bars used to compute moving averages and percentiles for volume. A larger value smooths the averages and percentiles but makes the indicator respond more slowly.
• vol_mult_input : The “spike” multiplier; the current buy or sell volume must be at least this multiple of its moving average over the lookback window to qualify as a breakout.
• rank_threshold_input (0–100) : Defines a volume percentile cutoff: the current buyer/seller volume must be in the top (100−threshold)%(100−threshold)% of all volumes within the lookback window. For example, if set to 80, the current volume must be in the top 20 % of the lookback distribution.
• ratio_threshold_input (0–1) : Specifies the minimum share of total volume that the buyer (for a bullish breakout) or seller (for bearish) must hold on the current bar; the code also requires that the cumulative buyer volume over the lookback window exceeds the seller volume (and vice versa for bearish cases).
• use_custom_tf_input / custom_tf_input : When enabled, these inputs override the automatic choice of lower timeframe for up/down volume; otherwise the script selects a sensible default based on the chart’s timeframe.
• Label appearance settings : Separate options control the ATR-based offset length, offset multiplier, label size and colors for bullish and bearish breakout labels, as well as the connector style and width.
3.3 Detection logic
1. Data preparation : Retrieve per‑side volume from the lower timeframe and take absolute values. Build rolling arrays of the last lookback_break_input values to compute simple moving averages (SMAs), cumulative sums and percentile ranks for buy and sell volume.
2. Volume spike: A spike is flagged when the current buy (or, in the bearish case, sell) volume is at least vol_mult_input times its SMA over the lookback window.
3. Dominance test: The buyer’s (or seller’s) share of total volume on the current bar must meet or exceed ratio_threshold_input. In addition, the cumulative sum of buyer volume over the window must exceed the cumulative sum of seller volume for a bullish breakout (and vice versa for bearish). A separate requirement checks the sign of delta: for bullish breakouts delta_breakout must be non‑negative; for bearish breakouts it must be non‑positive.
4. Percentile rank: The current volume must fall within the top (100 – rank_threshold_input) percent of the lookback distribution—ensuring that the spike is unusually large relative to recent history.
5. Price test: For a bullish signal, the closing price must close above the highest pivot (HH1); for a bearish signal, the close must be below the lowest pivot (LL1).
6. Labeling: When all conditions above are satisfied, the indicator prints “Breakout ↑” above the bar (bullish) or “Breakout ↓” below the bar (bearish). Labels are offset using half of an ATR‑based distance and linked to the candle with a dotted connector.
Figure caption, (Breakout ↑ example) , On this daily chart, price pushes above the red trendline and the highest prior pivot (HH1). The indicator recognizes this as a valid breakout because the buyer‑side volume on the lower timeframe spikes above its recent moving average and buyers dominate the volume statistics over the lookback period; when combined with a close above HH1, this satisfies the breakout conditions. The “Breakout ↑” label appears above the candle, and the info table highlights that up‑volume is elevated relative to its 11‑bar average, buyer share exceeds the dominance threshold and money‑flow metrics support the move.
Figure caption, In this daily example, price breaks below the lowest pivot (LL1) and the lower green trendline. The indicator identifies this as a bearish breakout because sell‑side volume is sharply elevated—about twice its 11‑bar average—and sellers dominate both the bar and the lookback window. With the close falling below LL1, the script triggers a Breakout ↓ label and marks the corresponding row in the info table, which shows strong down volume, negative delta and a seller share comfortably above the dominance threshold.
4. Market Phase Module (Volume Only)
4.1 Concept
Not all markets trend; many cycle between periods of accumulation (buying pressure building up), distribution (selling pressure dominating) and neutral behavior. This module classifies the current bar into one of these phases without using ATR , relying solely on buyer and seller volume statistics. It looks at net flows, ratio changes and an OBV‑like cumulative line with dual‑reference (1‑ and 2‑bar) trends. The result is displayed both as on‑chart labels and in a dedicated row of the info table.
4.2 Inputs
• phase_period_len: Number of bars over which to compute sums and ratios for phase detection.
• phase_ratio_thresh : Minimum buyer share (for accumulation) or minimum seller share (for distribution, derived as 1 − phase_ratio_thresh) of the total volume.
• strict_mode: When enabled, both the 1‑bar and 2‑bar changes in each statistic must agree on the direction (strict confirmation); when disabled, only one of the two references needs to agree (looser confirmation).
• Color customisation for info table cells and label styling for accumulation and distribution phases, including ATR length, multiplier, label size, colors and connector styles.
• show_phase_module: Toggles the entire phase detection subsystem.
• show_phase_labels: Controls whether on‑chart labels are drawn when accumulation or distribution is detected.
4.3 Detection logic
The module computes three families of statistics over the volume window defined by phase_period_len:
1. Net sum (buyers minus sellers): net_sum_phase = Σ(buy) − Σ(sell). A positive value indicates a predominance of buyers. The code also computes the differences between the current value and the values 1 and 2 bars ago (d_net_1, d_net_2) to derive up/down trends.
2. Buyer ratio: The instantaneous ratio TF_buy_breakout / TF_tot_breakout and the window ratio Σ(buy) / Σ(total). The current ratio must exceed phase_ratio_thresh for accumulation or fall below 1 − phase_ratio_thresh for distribution. The first and second differences of the window ratio (d_ratio_1, d_ratio_2) determine trend direction.
3. OBV‑like cumulative net flow: An on‑balance volume analogue obv_net_phase increments by TF_buy_breakout − TF_sell_breakout each bar. Its differences over the last 1 and 2 bars (d_obv_1, d_obv_2) provide trend clues.
The algorithm then combines these signals:
• For strict mode , accumulation requires: (a) current ratio ≥ threshold, (b) cumulative ratio ≥ threshold, (c) both ratio differences ≥ 0, (d) net sum differences ≥ 0, and (e) OBV differences ≥ 0. Distribution is the mirror case.
• For loose mode , it relaxes the directional tests: either the 1‑ or the 2‑bar difference needs to agree in each category.
If all conditions for accumulation are satisfied, the phase is labelled “Accumulation” ; if all conditions for distribution are satisfied, it’s labelled “Distribution” ; otherwise the phase is “Neutral” .
4.4 Outputs
• Info table row : Row 8 displays “Market Phase (Vol)” on the left and the detected phase (Accumulation, Distribution or Neutral) on the right. The text colour of both cells matches a user‑selectable palette (typically green for accumulation, red for distribution and grey for neutral).
• On‑chart labels : When show_phase_labels is enabled and a phase persists for at least one bar, the module prints a label above the bar ( “Accum” ) or below the bar ( “Dist” ) with a dashed or dotted connector. The label is offset using ATR based on phase_label_atr_len_input and phase_label_multiplier and is styled according to user preferences.
Figure caption, The chart displays a red “Dist” label above a particular bar, indicating that the accumulation/distribution module identified a distribution phase at that point. The detection is based on seller dominance: during that bar, the net buyer-minus-seller flow and the OBV‑style cumulative flow were trending down, and the buyer ratio had dropped below the preset threshold. These conditions satisfy the distribution criteria in strict mode. The label is placed above the bar using an ATR‑based offset and a dashed connector. By the time of the current bar in the screenshot, the phase indicator shows “Neutral” in the info table—signaling that neither accumulation nor distribution conditions are currently met—yet the historical “Dist” label remains to mark where the prior distribution phase began.
Figure caption, In this example the market phase module has signaled an Accumulation phase. Three bars before the current candle, the algorithm detected a shift toward buyers: up‑volume exceeded its moving average, down‑volume was below average, and the buyer share of total volume climbed above the threshold while the on‑balance net flow and cumulative ratios were trending upwards. The blue “Accum” label anchored below that bar marks the start of the phase; it remains on the chart because successive bars continue to satisfy the accumulation conditions. The info table confirms this: the “Market Phase (Vol)” row still reads Accumulation, and the ratio and sum rows show buyers dominating both on the current bar and across the lookback window.
5. OB/OS Spike Module
5.1 What overbought/oversold means here
In many markets, a rapid extension up or down is often followed by a period of consolidation or reversal. The indicator interprets overbought (OB) conditions as abnormally strong selling risk at or after a price rally and oversold (OS) conditions as unusually strong buying risk after a decline. Importantly, these are not direct trade signals; rather they flag areas where caution or contrarian setups may be appropriate.
5.2 Inputs
• minHits_obos (1–7): Minimum number of oscillators that must agree on an overbought or oversold condition for a label to print.
• syncWin_obos: Length of a small sliding window over which oscillator votes are smoothed by taking the maximum count observed. This helps filter out choppy signals.
• Volume spike criteria: kVolRatio_obos (ratio of current volume to its SMA) and zVolThr_obos (Z‑score threshold) across volLen_obos. Either threshold can trigger a spike.
• Oscillator toggles and periods: Each of RSI, Stochastic (K and D), Williams %R, CCI, MFI, DeMarker and Stochastic RSI can be independently enabled; their periods are adjustable.
• Label appearance: ATR‑based offset, size, colors for OB and OS labels, plus connector style and width.
5.3 Detection logic
1. Directional volume spikes: Volume spikes are computed separately for buyer and seller volumes. A sell volume spike (sellVolSpike) flags a potential OverBought bar, while a buy volume spike (buyVolSpike) flags a potential OverSold bar. A spike occurs when the respective volume exceeds kVolRatio_obos times its simple moving average over the window or when its Z‑score exceeds zVolThr_obos.
2. Oscillator votes: For each enabled oscillator, calculate its overbought and oversold state using standard thresholds (e.g., RSI ≥ 70 for OB and ≤ 30 for OS; Stochastic %K/%D ≥ 80 for OB and ≤ 20 for OS; etc.). Count how many oscillators vote for OB and how many vote for OS.
3. Minimum hits: Apply the smoothing window syncWin_obos to the vote counts using a maximum‑of‑last‑N approach. A candidate bar is only considered if the smoothed OB hit count ≥ minHits_obos (for OverBought) or the smoothed OS hit count ≥ minHits_obos (for OverSold).
4. Tie‑breaking: If both OverBought and OverSold spike conditions are present on the same bar, compare the smoothed hit counts: the side with the higher count is selected; ties default to OverBought.
5. Label printing: When conditions are met, the bar is labelled as “OverBought X/7” above the candle or “OverSold X/7” below it. “X” is the number of oscillators confirming, and the bracket lists the abbreviations of contributing oscillators. Labels are offset from price using half of an ATR‑scaled distance and can optionally include a dotted or dashed connector line.
Figure caption, In this chart the overbought/oversold module has flagged an OverSold signal. A sell‑off from the prior highs brought price down to the lower trend‑line, where the bar marked “OverSold 3/7 DeM” appears. This label indicates that on that bar the module detected a buy‑side volume spike and that at least three of the seven enabled oscillators—in this case including the DeMarker—were in oversold territory. The label is printed below the candle with a dotted connector, signaling that the market may be temporarily exhausted on the downside. After this oversold print, price begins to rebound towards the upper red trend‑line and higher pivot levels.
Figure caption, This example shows the overbought/oversold module in action. In the left‑hand panel you can see the OB/OS settings where each oscillator (RSI, Stochastic, Williams %R, CCI, MFI, DeMarker and Stochastic RSI) can be enabled or disabled, and the ATR length and label offset multiplier adjusted. On the chart itself, price has pushed up to the descending red trendline and triggered an “OverBought 3/7” label. That means the sell‑side volume spiked relative to its average and three out of the seven enabled oscillators were in overbought territory. The label is offset above the candle by half of an ATR and connected with a dashed line, signaling that upside momentum may be overextended and a pause or pullback could follow.
6. Buyer/Seller Trap Module
6.1 Concept
A bull trap occurs when price appears to break above resistance, attracting buyers, but fails to sustain the move and quickly reverses, leaving a long upper wick and trapping late entrants. A bear trap is the opposite: price breaks below support, lures in sellers, then snaps back, leaving a long lower wick and trapping shorts. This module detects such traps by looking for price structure sweeps, order‑flow mismatches and dominance reversals. It uses a scoring system to differentiate risk from confirmed traps.
6.2 Inputs
• trap_lookback_len: Window length used to rank extremes and detect sweeps.
• trap_wick_threshold: Minimum proportion of a bar’s range that must be wick (upper for bull traps, lower for bear traps) to qualify as a sweep.
• trap_score_risk: Minimum aggregated score required to flag a trap risk. (The code defines a trap_score_confirm input, but confirmation is actually based on price reversal rather than a separate score threshold.)
• trap_confirm_bars: Maximum number of bars allowed for price to reverse and confirm the trap. If price does not reverse in this window, the risk label will expire or remain unconfirmed.
• Label settings: ATR length and multiplier for offsetting, size, colours for risk and confirmed labels, and connector style and width. Separate settings exist for bull and bear traps.
• Toggle inputs: show_trap_module and show_trap_labels enable the module and control whether labels are drawn on the chart.
6.3 Scoring logic
The module assigns points to several conditions and sums them to determine whether a trap risk is present. For bull traps, the score is built from the following (bear traps mirror the logic with highs and lows swapped):
1. Sweep (2 points): Price trades above the high pivot (HH1) but fails to close above it and leaves a long upper wick at least trap_wick_threshold × range. For bear traps, price dips below the low pivot (LL1), fails to close below and leaves a long lower wick.
2. Close break (1 point): Price closes beyond HH1 or LL1 without leaving a long wick.
3. Candle/delta mismatch (2 points): The candle closes bullish yet the order flow delta is negative or the seller ratio exceeds 50%, indicating hidden supply. Conversely, a bearish close with positive delta or buyer dominance suggests hidden demand.
4. Dominance inversion (2 points): The current bar’s buyer volume has the highest rank in the lookback window while cumulative sums favor sellers, or vice versa.
5. Low‑volume break (1 point): Price crosses the pivot but total volume is below its moving average.
The total score for each side is compared to trap_score_risk. If the score is high enough, a “Bull Trap Risk” or “Bear Trap Risk” label is drawn, offset from the candle by half of an ATR‑scaled distance using a dashed outline. If, within trap_confirm_bars, price reverses beyond the opposite level—drops back below the high pivot for bull traps or rises above the low pivot for bear traps—the label is upgraded to a solid “Bull Trap” or “Bear Trap” . In this version of the code, there is no separate score threshold for confirmation: the variable trap_score_confirm is unused; confirmation depends solely on a successful price reversal within the specified number of bars.
Figure caption, In this example the trap module has flagged a Bear Trap Risk. Price initially breaks below the most recent low pivot (LL1), but the bar closes back above that level and leaves a long lower wick, suggesting a failed push lower. Combined with a mismatch between the candle direction and the order flow (buyers regain control) and a reversal in volume dominance, the aggregate score exceeds the risk threshold, so a dashed “Bear Trap Risk” label prints beneath the bar. The green and red trend lines mark the current low and high pivot trajectories, while the horizontal dashed lines show the highest and lowest values in the lookback window. If, within the next few bars, price closes decisively above the support, the risk label would upgrade to a solid “Bear Trap” label.
Figure caption, In this example the trap module has identified both ends of a price range. Near the highs, price briefly pushes above the descending red trendline and the recent pivot high, but fails to close there and leaves a noticeable upper wick. That combination of a sweep above resistance and order‑flow mismatch generates a Bull Trap Risk label with a dashed outline, warning that the upside break may not hold. At the opposite extreme, price later dips below the green trendline and the labelled low pivot, then quickly snaps back and closes higher. The long lower wick and subsequent price reversal upgrade the previous bear‑trap risk into a confirmed Bear Trap (solid label), indicating that sellers were caught on a false breakdown. Horizontal dashed lines mark the highest high and lowest low of the lookback window, while the red and green diagonals connect the earliest and latest pivot highs and lows to visualize the range.
7. Sharp Move Module
7.1 Concept
Markets sometimes display absorption or climax behavior—periods when one side steadily gains the upper hand before price breaks out with a sharp move. This module evaluates several order‑flow and volume conditions to anticipate such moves. Users can choose how many conditions must be met to flag a risk and how many (plus a price break) are required for confirmation.
7.2 Inputs
• sharp Lookback: Number of bars in the window used to compute moving averages, sums, percentile ranks and reference levels.
• sharpPercentile: Minimum percentile rank for the current side’s volume; the current buy (or sell) volume must be greater than or equal to this percentile of historical volumes over the lookback window.
• sharpVolMult: Multiplier used in the volume climax check. The current side’s volume must exceed this multiple of its average to count as a climax.
• sharpRatioThr: Minimum dominance ratio (current side’s volume relative to the opposite side) used in both the instant and cumulative dominance checks.
• sharpChurnThr: Maximum ratio of a bar’s range to its ATR for absorption/churn detection; lower values indicate more absorption (large volume in a small range).
• sharpScoreRisk: Minimum number of conditions that must be true to print a risk label.
• sharpScoreConfirm: Minimum number of conditions plus a price break required for confirmation.
• sharpCvdThr: Threshold for cumulative delta divergence versus price change (positive for bullish accumulation, negative for bearish distribution).
• Label settings: ATR length (sharpATRlen) and multiplier (sharpLabelMult) for positioning labels, label size, colors and connector styles for bullish and bearish sharp moves.
• Toggles: enableSharp activates the module; show_sharp_labels controls whether labels are drawn.
7.3 Conditions (six per side)
For each side, the indicator computes six boolean conditions and sums them to form a score:
1. Dominance (instant and cumulative):
– Instant dominance: current buy volume ≥ sharpRatioThr × current sell volume.
– Cumulative dominance: sum of buy volumes over the window ≥ sharpRatioThr × sum of sell volumes (and vice versa for bearish checks).
2. Accumulation/Distribution divergence: Over the lookback window, cumulative delta rises by at least sharpCvdThr while price fails to rise (bullish), or cumulative delta falls by at least sharpCvdThr while price fails to fall (bearish).
3. Volume climax: The current side’s volume is ≥ sharpVolMult × its average and the product of volume and bar range is the highest in the lookback window.
4. Absorption/Churn: The current side’s volume divided by the bar’s range equals the highest value in the window and the bar’s range divided by ATR ≤ sharpChurnThr (indicating large volume within a small range).
5. Percentile rank: The current side’s volume percentile rank is ≥ sharp Percentile.
6. Mirror logic for sellers: The above checks are repeated with buyer and seller roles swapped and the price break levels reversed.
Each condition that passes contributes one point to the corresponding side’s score (0 or 1). Risk and confirmation thresholds are then applied to these scores.
7.4 Scoring and labels
• Risk: If scoreBull ≥ sharpScoreRisk, a “Sharp ↑ Risk” label is drawn above the bar. If scoreBear ≥ sharpScoreRisk, a “Sharp ↓ Risk” label is drawn below the bar.
• Confirmation: A risk label is upgraded to “Sharp ↑” when scoreBull ≥ sharpScoreConfirm and the bar closes above the highest recent pivot (HH1); for bearish cases, confirmation requires scoreBear ≥ sharpScoreConfirm and a close below the lowest pivot (LL1).
• Label positioning: Labels are offset from the candle by ATR × sharpLabelMult (full ATR times multiplier), not half, and may include a dashed or dotted connector line if enabled.
Figure caption, In this chart both bullish and bearish sharp‑move setups have been flagged. Earlier in the range, a “Sharp ↓ Risk” label appears beneath a candle: the sell‑side score met the risk threshold, signaling that the combination of strong sell volume, dominance and absorption within a narrow range suggested a potential sharp decline. The price did not close below the lower pivot, so this label remains a “risk” and no confirmation occurred. Later, as the market recovered and volume shifted back to the buy side, a “Sharp ↑ Risk” label prints above a candle near the top of the channel. Here, buy‑side dominance, cumulative delta divergence and a volume climax aligned, but price has not yet closed above the upper pivot (HH1), so the alert is still a risk rather than a confirmed sharp‑up move.
Figure caption, In this chart a Sharp ↑ label is displayed above a candle, indicating that the sharp move module has confirmed a bullish breakout. Prior bars satisfied the risk threshold — showing buy‑side dominance, positive cumulative delta divergence, a volume climax and strong absorption in a narrow range — and this candle closes above the highest recent pivot, upgrading the earlier “Sharp ↑ Risk” alert to a full Sharp ↑ signal. The green label is offset from the candle with a dashed connector, while the red and green trend lines trace the high and low pivot trajectories and the dashed horizontals mark the highest and lowest values of the lookback window.
8. Market‑Maker / Spread‑Capture Module
8.1 Concept
Liquidity providers often “capture the spread” by buying and selling in almost equal amounts within a very narrow price range. These bars can signal temporary congestion before a move or reflect algorithmic activity. This module flags bars where both buyer and seller volumes are high, the price range is only a few ticks and the buy/sell split remains close to 50%. It helps traders spot potential liquidity pockets.
8.2 Inputs
• scalpLookback: Window length used to compute volume averages.
• scalpVolMult: Multiplier applied to each side’s average volume; both buy and sell volumes must exceed this multiple.
• scalpTickCount: Maximum allowed number of ticks in a bar’s range (calculated as (high − low) / minTick). A value of 1 or 2 captures ultra‑small bars; increasing it relaxes the range requirement.
• scalpDeltaRatio: Maximum deviation from a perfect 50/50 split. For example, 0.05 means the buyer share must be between 45% and 55%.
• Label settings: ATR length, multiplier, size, colors, connector style and width.
• Toggles : show_scalp_module and show_scalp_labels to enable the module and its labels.
8.3 Signal
When, on the current bar, both TF_buy_breakout and TF_sell_breakout exceed scalpVolMult times their respective averages and (high − low)/minTick ≤ scalpTickCount and the buyer share is within scalpDeltaRatio of 50%, the module prints a “Spread ↔” label above the bar. The label uses the same ATR offset logic as other modules and draws a connector if enabled.
Figure caption, In this chart the spread‑capture module has identified a potential liquidity pocket. Buyer and seller volumes both spiked above their recent averages, yet the candle’s range measured only a couple of ticks and the buy/sell split stayed close to 50 %. This combination met the module’s criteria, so it printed a grey “Spread ↔” label above the bar. The red and green trend lines link the earliest and latest high and low pivots, and the dashed horizontals mark the highest high and lowest low within the current lookback window.
9. Money Flow Module
9.1 Concept
To translate volume into a monetary measure, this module multiplies each side’s volume by the closing price. It tracks buying and selling system money default currency on a per-bar basis and sums them over a chosen period. The difference between buy and sell currencies (Δ$) shows net inflow or outflow.
9.2 Inputs
• mf_period_len_mf: Number of bars used for summing buy and sell dollars.
• Label appearance settings: ATR length, multiplier, size, colors for up/down labels, and connector style and width.
• Toggles: Use enableMoneyFlowLabel_mf and showMFLabels to control whether the module and its labels are displayed.
9.3 Calculations
• Per-bar money: Buy $ = TF_buy_breakout × close; Sell $ = TF_sell_breakout × close. Their difference is Δ$ = Buy $ − Sell $.
• Summations: Over mf_period_len_mf bars, compute Σ Buy $, Σ Sell $ and ΣΔ$ using math.sum().
• Info table entries: Rows 9–13 display these values as texts like “↑ USD 1234 (1M)” or “ΣΔ USD −5678 (14)”, with colors reflecting whether buyers or sellers dominate.
• Money flow status: If Δ$ is positive the bar is marked “Money flow in” ; if negative, “Money flow out” ; if zero, “Neutral”. The cumulative status is similarly derived from ΣΔ.Labels print at the bar that changes the sign of ΣΔ, offset using ATR × label multiplier and styled per user preferences.
Figure caption, The chart illustrates a steady rise toward the highest recent pivot (HH1) with price riding between a rising green trend‑line and a red trend‑line drawn through earlier pivot highs. A green Money flow in label appears above the bar near the top of the channel, signaling that net dollar flow turned positive on this bar: buy‑side dollar volume exceeded sell‑side dollar volume, pushing the cumulative sum ΣΔ$ above zero. In the info table, the “Money flow (bar)” and “Money flow Σ” rows both read In, confirming that the indicator’s money‑flow module has detected an inflow at both bar and aggregate levels, while other modules (pivots, trend lines and support/resistance) remain active to provide structural context.
In this example the Money Flow module signals a net outflow. Price has been trending downward: successive high pivots form a falling red trend‑line and the low pivots form a descending green support line. When the latest bar broke below the previous low pivot (LL1), both the bar‑level and cumulative net dollar flow turned negative—selling volume at the close exceeded buying volume and pushed the cumulative Δ$ below zero. The module reacts by printing a red “Money flow out” label beneath the candle; the info table confirms that the “Money flow (bar)” and “Money flow Σ” rows both show Out, indicating sustained dominance of sellers in this period.
10. Info Table
10.1 Purpose
When enabled, the Info Table appears in the lower right of your chart. It summarises key values computed by the indicator—such as buy and sell volume, delta, total volume, breakout status, market phase, and money flow—so you can see at a glance which side is dominant and which signals are active.
10.2 Symbols
• ↑ / ↓ — Up (↑) denotes buy volume or money; down (↓) denotes sell volume or money.
• MA — Moving average. In the table it shows the average value of a series over the lookback period.
• Σ (Sigma) — Cumulative sum over the chosen lookback period.
• Δ (Delta) — Difference between buy and sell values.
• B / S — Buyer and seller share of total volume, expressed as percentages.
• Ref. Price — Reference price for breakout calculations, based on the latest pivot.
• Status — Indicates whether a breakout condition is currently active (True) or has failed.
10.3 Row definitions
1. Up volume / MA up volume – Displays current buy volume on the lower timeframe and its moving average over the lookback period.
2. Down volume / MA down volume – Shows current sell volume and its moving average; sell values are formatted in red for clarity.
3. Δ / ΣΔ – Lists the difference between buy and sell volume for the current bar and the cumulative delta volume over the lookback period.
4. Σ / MA Σ (Vol/MA) – Total volume (buy + sell) for the bar, with the ratio of this volume to its moving average; the right cell shows the average total volume.
5. B/S ratio – Buy and sell share of the total volume: current bar percentages and the average percentages across the lookback period.
6. Buyer Rank / Seller Rank – Ranks the bar’s buy and sell volumes among the last (n) bars; lower rank numbers indicate higher relative volume.
7. Σ Buy / Σ Sell – Sum of buy and sell volumes over the lookback window, indicating which side has traded more.
8. Breakout UP / DOWN – Shows the breakout thresholds (Ref. Price) and whether the breakout condition is active (True) or has failed.
9. Market Phase (Vol) – Reports the current volume‑only phase: Accumulation, Distribution or Neutral.
10. Money Flow – The final rows display dollar amounts and status:
– ↑ USD / Σ↑ USD – Buy dollars for the current bar and the cumulative sum over the money‑flow period.
– ↓ USD / Σ↓ USD – Sell dollars and their cumulative sum.
– Δ USD / ΣΔ USD – Net dollar difference (buy minus sell) for the bar and cumulatively.
– Money flow (bar) – Indicates whether the bar’s net dollar flow is positive (In), negative (Out) or neutral.
– Money flow Σ – Shows whether the cumulative net dollar flow across the chosen period is positive, negative or neutral.
The chart above shows a sequence of different signals from the indicator. A Bull Trap Risk appears after price briefly pushes above resistance but fails to hold, then a green Accum label identifies an accumulation phase. An upward breakout follows, confirmed by a Money flow in print. Later, a Sharp ↓ Risk warns of a possible sharp downturn; after price dips below support but quickly recovers, a Bear Trap label marks a false breakdown. The highlighted info table in the center summarizes key metrics at that moment, including current and average buy/sell volumes, net delta, total volume versus its moving average, breakout status (up and down), market phase (volume), and bar‑level and cumulative money flow (In/Out).
11. Conclusion & Final Remarks
This indicator was developed as a holistic study of market structure and order flow. It brings together several well‑known concepts from technical analysis—breakouts, accumulation and distribution phases, overbought and oversold extremes, bull and bear traps, sharp directional moves, market‑maker spread bars and money flow—into a single Pine Script tool. Each module is based on widely recognized trading ideas and was implemented after consulting reference materials and example strategies, so you can see in real time how these concepts interact on your chart.
A distinctive feature of this indicator is its reliance on per‑side volume: instead of tallying only total volume, it separately measures buy and sell transactions on a lower time frame. This approach gives a clearer view of who is in control—buyers or sellers—and helps filter breakouts, detect phases of accumulation or distribution, recognize potential traps, anticipate sharp moves and gauge whether liquidity providers are active. The money‑flow module extends this analysis by converting volume into currency values and tracking net inflow or outflow across a chosen window.
Although comprehensive, this indicator is intended solely as a guide. It highlights conditions and statistics that many traders find useful, but it does not generate trading signals or guarantee results. Ultimately, you remain responsible for your positions. Use the information presented here to inform your analysis, combine it with other tools and risk‑management techniques, and always make your own decisions when trading.

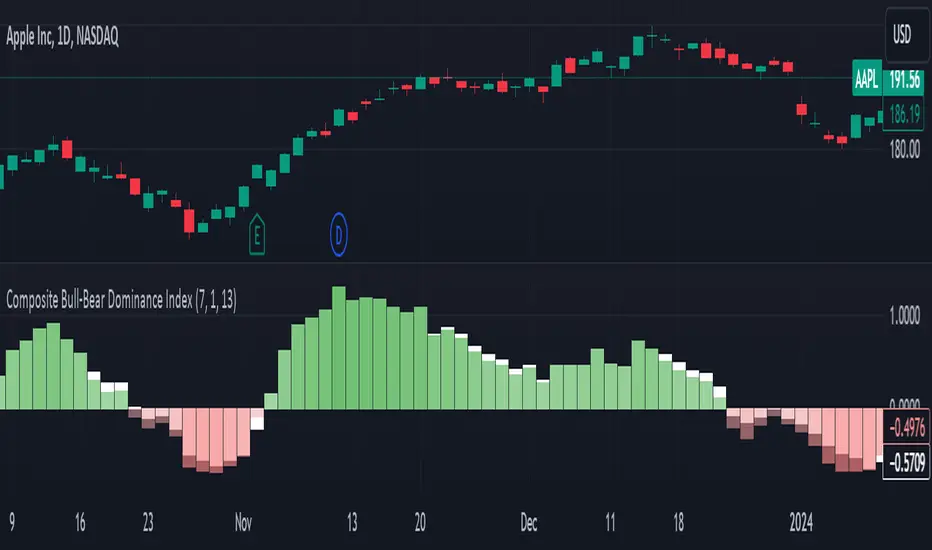
Composite Bull-Bear Dominance IndexNote: CREDITS: This is based on the Up Down Volume Indicator (published in Trading View) and Elder Ray Index (Bull Bear Power).
The Composite Bull Bear Dominance Index (CBBDI) is a indicator that combines up down volume analysis with Bull and Bear Power to provide a comprehensive view of market dynamics. It calculates Z-scores for up down volume delta and bull bear power measures, averages them, and then smoothes the result using Weighted Moving Average (WMA) for Bull and Bear Power and Volume Weighted Moving Average (VWMA) for Up and Down Volume Delta. The advantages include responsiveness to short-term trends, noise reduction through weighting, incorporation of volume information, and the ability to identify significant changes in buying and selling pressure. The indicator aims to offer clear signals for traders seeking insights into overall market dominance and indicate if the bulls or the bears have the upper hand.
Volume Analysis (Up/Down Volume Delta):
Up/Down Volume Delta reflects the net difference between buying and selling volume, providing insights into the prevailing market sentiment.
Positive Delta: Indicates potential bullish dominance due to higher buying volume.
Negative Delta: Suggests potential bearish dominance as selling volume surpasses buying volume.
Price Analysis (Bull and Bear Power):
Bull and Bear Power measure the strength of buying and selling forces based on price movements and the Exponential Moving Average (EMA) of the closing price.
Positive Bull Power: Reflects bullish dominance, indicating potential upward momentum.
Positive Bear Power: Suggests bearish dominance, indicating potential downward momentum.
Composite Bull Bear Dominance Index (CBBDI):
CBBDI combines the standardized Z-scores of Up/Down Volume Delta and Bull Bear Power, providing an average measure of both volume and price-related dominance.
Positive CBBDI: Indicates an overall bullish dominance in both volume and price dynamics.
Negative CBBDI: Suggests an overall bearish dominance in both volume and price dynamics.
Smoothing Techniques:
The use of Weighted Moving Average (WMA) for smoothing Bull and Bear Power Z-scores, and Volume Weighted Moving Average (VWMA) for smoothing Up/Down Volume Delta, reduces noise and provides a clearer trend signal.
Smoothing helps filter out short-term fluctuations and emphasizes more significant trends in both volume and price movements.
Color Coding:
CBBDI values are color-coded based on their direction, visually representing the prevailing market sentiment.
Green Colors: Positive values indicate potential bullish dominance.
Red Colors: Negative values suggest potential bearish dominance.
Delta Candle ColorsThe Delta Divergences indicator provides a visual representation of volume delta, which measures the difference between buying pressure and selling pressure within a candle. This is achieved by using intrabar (lower timeframe) volume and price fluctuations to estimate the delta between buying and selling pressure within each bar.
By color-coding candles based on this volume delta, traders can gain insight into the strength behind price movements and spot potential divergences. When a candle closes positively (higher than the previous close) but the volume delta is negative (more selling than buying), or when a candle closes negatively with a positive delta (more buying than selling), it indicates a divergence. These divergences can signal potential trend exhaustion or possible reversals.
The indicator includes custom alerts that notify the trader when these divergences occur:
Positive close with negative delta: Signals that the price is rising, but selling pressure is higher.
Negative close with positive delta: Signals that the price is falling, but buying pressure is higher.
In addition to color-coding candles based on delta, the indicator provides an option to display delta labels directly on the chart for each candle.
Finally, the option to only show divergences can be turned on. When enabled, non-divergent candles are colored normally, while only candles with delta divergences are highlighted, allowing traders to focus on the most relevant market information.

Volume Footprint Anomaly Scanner [PhenLabs]📊 PhenLabs - Volume Footprint Anomaly Scanner (VFAS)
Version: PineScript™ v6
📌 Description
The PhenLabs Volume Footprint Anomaly Scanner (VFAS) is an advanced Pine Script indicator designed to detect and highlight significant imbalances in buying and selling pressure within individual price bars. By analyzing a calculated "Delta" – the net difference between estimated buy and sell volume – and employing statistical Z-score analysis, VFAS pinpoints moments when buying or selling activity becomes unusually dominant. This script was created not in hopes of creating a "Buy and Sell" indicator but rather providing the user with a more in-depth insight into the intrabar volume delta and how it can fluctuate in unusual ways, leading to anomalies that can be capitalized on.
This indicator helps traders identify high-conviction points where strong market participants are active, signaling potential shifts in momentum or continuation of a trend. It aims to provide a clearer understanding of underlying market dynamics, allowing for more informed decision-making in various trading strategies, from identifying entry points to confirming trend strength.
🚀 Points of Innovation
● Z-Score for Delta Analysis : Utilizes statistical Z-scores to objectively identify statistically significant anomalies in buying/selling pressure, moving beyond simple, arbitrary thresholds.
● Dynamic Confidence Scoring : Assigns a multi-star confidence rating (1-4 stars) to each signal, factoring in high volume, trend alignment, and specific confirmation criteria, providing a nuanced view of signal strength.
● Integrated Trend Filtering : Offers an optional Exponential Moving Average (EMA)-based trend filter to ensure signals align with the broader market direction, reducing false positives in ranging markets.
● Strict Confirmation Logic : Implements specific confirmation criteria for higher-confidence signals, including price action and a time-based gap from previous signals, enhancing reliability.
● Intuitive Info Dashboard : Provides a real-time summary of market trend and the latest signal's direction and confidence directly on the chart, streamlining information access.
🔧 Core Components
● Core Delta Engine : Estimates the net buying/selling pressure (bar Delta) by analyzing price movement within each bar relative to volume. It also calculates average volume to identify bars with unusually high activity.
● Anomaly Detection (Z-Score) : Computes the Z-score for the current bar's Delta, indicating how many standard deviations it is from its recent average. This statistical measure is central to identifying significant anomalies.
● Trend Filter : Utilizes a dual Exponential Moving Average (EMA) cross-over system to define the prevailing market trend (uptrend, downtrend, or range), providing contextual awareness.
● Signal Processing & Confidence Algorithm : Evaluates anomaly conditions against trend filters and confirmation rules, then calculates a dynamic confidence score to produce actionable, contextualized signal information.
🔥 Key Features
● Advanced Delta Anomaly Detection : Pinpoints bars with exceptionally high buying or selling pressure, indicating potential institutional activity or strong market conviction.
● Multi-Factor Confidence Scoring : Each signal comes with a 1-4 star rating, clearly communicating its reliability based on high volume, trend alignment, and specific confirmation criteria.
● Optional Trend Alignment : Users can choose to filter signals, so only those aligned with the prevailing EMA-defined trend are displayed, enhancing signal quality.
● Interactive Signal Labels : Displays compact labels on the chart at anomaly points, offering detailed tooltips upon hover, including signal type, direction, confidence, and contextual information.
● Customizable Bar Colors : Visually highlights bars with Delta anomalies, providing an immediate visual cue for strong buying or selling activity.
● Real-time Info Dashboard : A clean, customizable dashboard shows the current market trend and details of the latest detected signal, keeping key information accessible at a glance.
● Configurable Alerts : Set up alerts for bullish or bearish Delta anomalies to receive real-time notifications when significant market pressure shifts occur.
🎨 Visualization
Signal Labels :
* Placed at the top/bottom of anomaly bars, showing a "📈" (bullish) or "📉" (bearish) icon.
* Tooltip: Hovering over a label reveals detailed information: Signal Type (e.g., "Delta Anomaly"), Direction, Confidence (e.g., "★★★☆"), and a descriptive explanation of the anomaly.
* Interpretation: Clearly marks actionable signals and provides deep insights without cluttering the chart, enabling quick assessment of signal strength and context.
● Info Dashboard :
* Located at the top-right of the chart, providing a clean summary.
* Displays: "PhenLabs - VFAS" header, "Market Trend" (Uptrend/Downtrend/Range with color-coded status), and "Direction | Conf." (showing the last signal's direction and star confidence).
* Optional "💡 Hover over signals for details" reminder.
* Interpretation: A concise, real-time summary of the market's pulse and the most recent high-conviction event, helping traders stay informed at a glance.
📖 Usage Guidelines
Setting Categories
⚙️ Core Delta & Volume Engine
● Minimum Volume Lookback (Bars)
○ Default: 9
○ Range: Integer (e.g., 5-50)
○ Description: Defines the number of preceding bars used to calculate the average volume and delta. Bars with volume below this average won't be considered for high-volume signals. A shorter lookback is more reactive to recent changes, while a longer one provides a smoother average.
📈 Anomaly Detection Settings
Delta Z-Score Anomaly Threshold
○ Default: 2.5
○ Range: Float (e.g., 1.0-5.0+)
○ Description: The number of standard deviations from the mean that a bar's delta must exceed to be considered a significant anomaly. A higher threshold means fewer, but potentially stronger, signals. A lower threshold will generate more signals, which might include less significant events. Experiment to find the optimal balance for your trading style.
🔬 Context Filters
Enable Trend Filter
○ Default: False
○ Range: Boolean (True/False)
○ Description: When enabled, signals will only be generated if they align with the current market trend as determined by the EMAs (e.g., only bullish signals in an uptrend, bearish in a downtrend). This helps to filter out counter-trend noise.
● Trend EMA Fast
○ Default: 50
○ Range: Integer (e.g., 10-100)
○ Description: The period for the faster Exponential Moving Average used in the trend filter. In combination with the slow EMA, it defines the trend direction.
● Trend EMA Slow
○ Default: 200
○ Range: Integer (e.g., 100-400)
○ Description: The period for the slower Exponential Moving Average used in the trend filter. The relationship between the fast and slow EMA determines if the market is in an uptrend (fast > slow) or downtrend (fast < slow).
🎨 Visual & UI Settings
● Show Info Dashboard
○ Default: True
○ Range: Boolean (True/False)
○ Description: Toggles the visibility of the dashboard on the chart, which provides a summary of market trend and the last detected signal.
● Show Dashboard Tooltip
○ Default: True
○ Range: Boolean (True/False)
○ Description: Toggles a reminder message in the dashboard to hover over signal labels for more detailed information.
● Show Delta Anomaly Bar Colors
○ Default: True
○ Range: Boolean (True/False)
○ Description: Enables or disables the coloring of bars based on their delta direction and whether they represent a significant anomaly.
● Show Signal Labels
○ Default: True
○ Range: Boolean (True/False)
○ Description: Controls the visibility of the “📈” or “📉” labels that appear on the chart when a delta anomaly signal is generated.
🔔 Alert Settings
Alert on Delta Anomaly
○ Default: True
○ Range: Boolean (True/False)
○ Description: When enabled, this setting allows you to set up alerts in TradingView that will trigger whenever a new bullish or bearish delta anomaly is detected.
✅ Best Use Cases
Early Trend Reversal / Continuation Detection: Identify strong surges of buying/selling pressure at key support/resistance levels that could indicate a reversal or the continuation of a strong move.
● Confirmation of Breakouts: Use high-confidence delta anomalies to confirm the validity of price breakouts, indicating strong conviction behind the move.
● Entry and Exit Points: Pinpoint precise entry opportunities when anomalies align with your trading strategy, or identify potential exhaustion signals for exiting trades.
● Scalping and Day Trading: The indicator’s sensitivity to intraday buying/selling imbalances makes it highly effective for short-term trading strategies.
● Market Sentiment Analysis: Gain a real-time understanding of underlying market sentiment by observing the prevalence and strength of bullish vs. bearish anomalies.
⚠️ Limitations
Estimated Delta: The script uses a simplified method to estimate delta based on bar close relative to its range, not actual order book or footprint data. While effective, it’s an approximation.
● Sensitivity to Z-Score Threshold: The effectiveness heavily relies on the `Delta Z-Score Anomaly Threshold`. Too low, and you’ll get many false positives; too high, and you might miss valid signals.
● Confirmation Criteria: The 4-star confidence level’s “confirmation” relies on specific subsequent bar conditions and previous confirmed signals, which might be too strict or specific for all contexts.
● Requires Context: While powerful, VFAS is best used in conjunction with other technical analysis tools and price action to form a comprehensive trading strategy. It is not a standalone “buy/sell” signal.
💡 What Makes This Unique
Statistical Rigor: The application of Z-score analysis to bar delta provides an objective, statistically-driven way to identify true anomalies, moving beyond arbitrary thresholds.
● Multi-Factor Confidence Scoring: The unique 1-4 star confidence system integrates multiple market dynamics (volume, trend alignment, specific follow-through) into a single, easy-to-interpret rating.
● User-Friendly Design: From the intuitive dashboard to the detailed signal tooltips, the indicator prioritizes clear and accessible information for traders of all experience levels.
🔬 How It Works
1. Bar Delta Calculation:
● The script first estimates the “buy volume” and “sell volume” for each bar. This is done by assuming that volume proportional to the distance from the low to the close represents buying, and volume proportional to the distance from the high to the close represents selling.
● How this contributes: This provides a proxy for the net buying or selling pressure (delta) within that specific price bar, even without access to actual footprint data.
2. Volume & Delta Z-Score Analysis:
● The average volume over a user-defined lookback period is calculated. Bars with volume less than twice this average are generally considered of lower interest.
● The Z-score for the calculated bar delta is computed. The Z-score measures how many standard deviations the current bar’s delta is from its average delta over the `Minimum Volume Lookback` period.
● How this contributes: A high positive Z-score indicates a bullish delta anomaly (significantly more buying than usual), while a high negative Z-score indicates a bearish delta anomaly (significantly more selling than usual). This identifies statistically unusual levels of pressure.
3. Trend Filtering (Optional):
● Two Exponential Moving Averages (Fast and Slow EMA) are used to determine the prevailing market trend. An uptrend is identified when the Fast EMA is above the Slow EMA, and a downtrend when the Fast EMA is below the Slow EMA.
● How this contributes: If enabled, the indicator will only display bullish delta anomalies during an uptrend and bearish delta anomalies during a downtrend, helping to confirm signals within the broader market context and avoid counter-trend signals.
4. Signal Generation & Confidence Scoring:
● When a delta Z-score exceeds the user-defined anomaly threshold, a signal is generated.
● This signal is then passed through a multi-factor confidence algorithm (`f_calculateConfidence`). It awards stars based on: high volume presence, alignment with the overall trend (if enabled), and a fourth star for very strong Z-scores (above 3.0) combined with specific follow-through candle patterns after a cooling-off period from a previous confirmed signal.
● How this contributes: Provides a qualitative rating (1-4 stars) for each anomaly, allowing traders to quickly assess the potential significance and reliability of the signal.
💡 Note:
The PhenLabs Volume Footprint Anomaly Scanner is a powerful analytical tool, but it’s crucial to understand that no indicator guarantees profit. Always backtest and forward-test the indicator settings on your chosen assets and timeframes. Consider integrating VFAS with your existing trading strategy, using its signals as confirmation for entries, exits, or trend bias. The Z-score threshold is highly customizable; lower values will yield more signals (including potential noise), while higher values will provide fewer but potentially higher-conviction signals. Adjust this parameter based on market volatility and your risk tolerance. Remember to combine statistical insights from VFAS with price action, support/resistance levels, and your overall market outlook for optimal results.

CVD Trend IndikatorCVD Trend Indicator (Cumulative Volume Delta)
This Pine Script indicator is designed to help traders visualize the underlying buying and selling pressure in the market by analyzing the Cumulative Volume Delta (CVD). It provides insights into whether buyers or sellers are more aggressive over time, aiding in trend confirmation and potential reversal identification.
How it Works:
The indicator calculates the Cumulative Volume Delta for each candlestick.
If the candle closes higher than it opened (close > open), its entire volume is considered buying volume (positive delta).
If the candle closes lower than it opened (close < open), its entire volume is considered selling volume (negative delta).
If the candle closes at the same price it opened (close == open), its delta is considered zero.
These individual candle deltas are then cumulatively summed up over time, creating the CVD line. A rising CVD indicates increasing buying pressure, while a falling CVD suggests growing selling pressure.
The indicator also features an optional Simple Moving Average (SMA) of the CVD, which helps smooth out the CVD line and identify the prevailing trend in buying/selling pressure more clearly.
Key Features:
Cumulative Volume Delta (CVD) Line:
Rising CVD (Blue Line): Indicates aggressive buying pressure is dominant, supporting bullish price action.
Falling CVD (Blue Line): Suggests aggressive selling pressure is dominant, supporting bearish price action.
CVD Moving Average (Red Line, optional):
A user-defined SMA of the CVD, which acts as a trend filter for the volume delta.
When the CVD crosses above its MA, it can signal increasing buying momentum.
When the CVD crosses below its MA, it can signal increasing selling momentum.
Session Reset:
The CVD automatically resets at the beginning of each new trading session (daily by default). This provides a fresh perspective on the day's accumulated buying or selling pressure, which is particularly useful for day traders.
Background Color Visuals:
The indicator panel's background changes color to visually represent periods of dominant buying pressure (green background when CVD > CVD MA) or selling pressure (red background when CVD < CVD MA), offering a quick glance at the market's underlying bias.
Trading Insights:
Trend Confirmation: Use a rising CVD (and its MA) to confirm an uptrend, or a falling CVD (and its MA) to confirm a downtrend.
Divergences: Look for CVD Divergences as potential reversal signals:
Bullish Divergence: Price makes a lower low, but CVD makes a higher low (suggests selling pressure is weakening).
Bearish Divergence: Price makes a higher high, but CVD makes a lower high (suggests buying pressure is weakening).
Momentum Shifts: Sudden, sharp changes in the CVD's direction or its cross over/under its MA can signal shifts in market momentum.
Support/Resistance Confirmation: Observe CVD behavior around key price levels. Weakening buying pressure at resistance or weakening selling pressure at support can confirm the strength of these levels.
Customization:
showMA: Toggle the visibility of the CVD's Moving Average.
maLength: Adjust the period for the CVD's Moving Average to control its sensitivity to recent price action. A shorter length makes it more reactive, while a longer length makes it smoother.
Disclaimer: No indicator is foolproof. Always use the CVD Trend Indicator in conjunction with other technical analysis tools, price action, and robust risk management strategies. Backtesting and forward testing are crucial for understanding its effectiveness in different market conditions and timeframes.

Cumulative Delta [TradingFinder] Volume + Periodic + EMA🔵 Introduction
To fully grasp the concept of Cumulative Volume Delta (CVD), it's essential first to understand Volume Delta. In trading and technical analysis, the term "Delta" typically refers to the difference between two values or the rate of change between two data points.
Volume Delta represents the difference between buying and selling pressure, calculated for each candlestick on a chart. This difference can vary across different timeframes.
A positive delta indicates that buying volume exceeds selling volume, while a negative delta shows that selling volume is greater. When buying and selling volumes are equal, the volume delta equals zero.
🟣 What is Cumulative Volume Delta (CVD)?
Cumulative Volume Delta (CVD) is a powerful tool in technical analysis that aggregates delta values for each candlestick, creating a comprehensive indicator that helps traders assess market trends.
Unlike the standard Volume Delta, which compares delta on a candle-by-candle basis, CVD provides insight into the overall buying and selling pressure during key market swings. A downward-trending CVD suggests that selling pressure is dominating, which is typically a bearish signal.
Conversely, an upward-trending CVD indicates bullish sentiment. This analysis becomes even more significant when comparing CVD with price action and market structure, helping traders to predict asset price directions.
By evaluating market highs and lows, one can determine the market trend. A consistent rise in these points indicates an uptrend, while a consistent fall suggests a downtrend.
🔵 How to Use
Understanding how to detect trend changes using Cumulative Volume Delta is crucial for traders. Typically, CVD aligns with market structure, moving in the same direction as price trends.
However, divergences between CVD and price trends or signs of exhaustion in volume can be powerful indicators of potential market reversals. Recognizing these patterns can help traders make informed decisions and improve their trading strategies.
🟣 Identifying Trend Exhaustion with Cumulative Volume Delta (CVD)
The Cumulative Volume Delta (CVD) indicator is especially effective in identifying weakening trends in the market. For instance, if gold's price hits a new low, but CVD does not follow suit, this may indicate a lack of seller interest despite the new low, signaling potential seller exhaustion.
Most traders interpret this as a possible reversal from a bearish to a bullish trend. Similarly, if gold reaches a new high but CVD fails to do the same, it can suggest that buyers lack the strength to push the market higher, indicating a possible trend reversal.
🟣 Utilizing Cumulative Volume Delta (CVD) Divergence in Price Trend Analysis
Another effective use of CVD is identifying divergences in price trends. For example, if CVD breaks a previous high or low while the price remains stable, this divergence often indicates that buying or selling pressure is being absorbed.
For instance, if CVD rises sharply without a corresponding increase in gold prices, it may suggest that sellers are absorbing the buying pressure, potentially leading to a strong sell-off. Conversely, if gold prices remain stable while CVD declines, it could indicate that buyers are absorbing selling pressure, likely leading to a price increase once selling subsides.
🔵 Setting
Cumulative Mode : It has three modes "Total", "Periodic" and "EMA". In "Total" mode, it collects the volume from the beginning to the end. In "Periodic" mode, it accumulates the volume periodically and in "EMA" mode, it calculates the moving average of the volume.
Period : You can set the period of " Periodic " and " EMA " modes.
Market Ultra Data : If you turn on this feature, 26 large brokers will be included in the calculation of the trading volume.
The advantage of this capability is to have more reliable volume data. You should be careful to specify the market you are in, FOREX brokers and Crypto brokers are different.
🔵 Conclusion
Cumulative Volume Delta (CVD) is a powerful analytical tool in financial markets that helps analysts and traders assess buying and selling pressure by aggregating and combining the volume delta for each candlestick.
CVD can indicate the strength or weakness of a market trend. When CVD moves upward, it signals that buying pressure is dominant and is considered a bullish signal; conversely, a downward movement in CVD indicates that selling pressure is stronger and is viewed as a bearish signal.
This indicator is particularly effective in identifying divergences and exhaustion in market trends. For example, if CVD does not align with price movements, it may suggest a potential trend reversal.
Traders use this information to make more informed trading decisions, especially when identifying entry and exit points in the market.
Overall, CVD is a tool that enables analysts to better understand market fluctuations and more accurately predict future market trends.

nOI + Funding + CVD • strategynOI + Funding + CVD Strategy
Overview
This strategy is designed for cryptocurrency trading on platforms like TradingView, focusing on perpetual futures markets. It combines three key indicators—Normalized Open Interest (nOI), Funding Rate, and Cumulative Volume Delta (CVD)—to generate buy and sell signals for long and short positions. The strategy aims to capitalize on market imbalances, such as overextended open interest, funding rate extremes, and volume deltas, which often signal potential reversals or continuations in trending markets.
The script supports pyramiding (up to 10 positions), uses percentage-based position sizing (default 10% of equity per trade), and allows customization of trade directions (longs and shorts can be enabled/disabled independently). It includes multiple signal systems for entries, various exit mechanisms (including stop-loss, take-profit, time-based exits, and conditional closes based on indicators), a Martingale add-on system for averaging positions during drawdowns, and handling of opposite signals (ignore, close, or reverse).
This strategy is not financial advice; backtest thoroughly and use at your own risk. It requires data sources for Open Interest (OI) and Funding Rates, which are fetched via TradingView's security functions (e.g., from Binance for funding premiums).
Key Indicators
1. Normalized Open Interest (nOI)
Group: Open Interest
Purpose: Measures the relative level of open interest over a lookback window to identify overbought (high OI) or oversold (low OI) conditions, which can indicate potential exhaustion in trends.
Calculation:
Fetches OI data (close) from the symbol's standard ticker (e.g., "{symbol}_OI").
Normalizes OI within a user-defined window (default: 500 bars) using min-max scaling: (OI - min_OI) / (max_OI - min_OI) * 100.
Upper threshold (default: 70%): Signals potential short opportunities when crossed from above.
Lower threshold (default: 30%): Signals potential long opportunities when crossed from below.
Visualization: Plotted as a line (teal above upper, red below lower, gray in between). Horizontal lines at upper, mid (50%), lower, and a separator at 102%.
Notes: Handles non-crypto symbols by adjusting timeframe to daily if intraday. Errors if no OI data available.
2. Funding Rate
Group: Funding Rate
Purpose: Tracks the average funding rate (premium index) to detect market sentiment extremes. Positive funding suggests bull bias (longs pay shorts), negative suggests bear bias.
Calculation:
Fetches premium index data from Binance (e.g., "binance:{base}usdt_premium").
Supports lower timeframe aggregation (default: enabled, using 1-min TF) for smoother data.
Averages open and close premiums, clamps values, and scales/shifts for plotting (base: 150, scale: 1000x).
Upper threshold (default: 1.0%): Overheat for shorts.
Lower threshold (default: 1.0%): Overcool for longs.
Ultra level (default: 1.8%): Extreme for additional short signals.
Smoothing: Uses inverse weighted moving average (IWMA) or lower-TF aggregation to reduce noise.
Visualization: Shifted plot (green positive, red negative) with filled areas. Horizontal lines for overheat, overcool, base (0%), and ultra.
Notes: Custom ticker option for non-standard symbols.
3. Cumulative Volume Delta (CVD)
Group: CVD (Cumulative Volume Delta)
Purpose: Measures net buying/selling pressure via volume delta, normalized to identify divergences or confirmations with price.
Calculation:
Delta: +volume if close > open, -volume if close < open.
Cumulative: Rolling cumsum over a window (default: 500 bars), smoothed with EMA (default: 20).
Normalized: Scaled by absolute max in window (-1 to 1 range).
Scaled/shifted for plotting (base: 300 or 0 if anchored, scale: 120x).
Upper threshold (default: 1.0%): Over for shorts.
Lower threshold (default: 1.0%): Under for longs.
Visualization: Shifted plot (aqua positive, purple negative) with filled areas. Horizontal lines for over, under, and separator (default: 252).
Filter Options (for Signal A):
Enable filter (default: false).
Require sign match (Long ≥0, Short ≤0).
Require extreme zones.
Require momentum (rising/falling over N bars, default: 3).
Signal Logics for Entries
Entries are triggered by buy/sell signals from multiple systems (A, B, C, D), filtered by direction toggles and entry conditions.
Signal System A: OI + Funding (with optional CVD filter)
Enabled: Default true.
Sell (Short): nOI > upper threshold, falling over N bars (default: 3), delta ≥ threshold (default: 3%), funding > overheat, and CVD filter OK.
Buy (Long): nOI < lower threshold, rising over N bars (default: 3), delta ≥ threshold (default: 3%), funding < overcool, and CVD filter OK.
Signal System B: Short - Funding Crossunder + Filters
Enabled: Default true.
Sell (Short): Funding crosses under overheat level, optional: CVD > over, nOI < upper.
Signal System C: Short - Ultra Funding
Enabled: Default false.
Sell (Short): Funding crosses ultra level (up or down, both default true).
Signal System D: Long - Funding Crossover + Filters
Enabled: Default true.
Buy (Long): Funding crosses over overcool level, optional: CVD < under, nOI > lower.
Combined: Sell if A/B/C active; Buy if A/D active.
Entry Filters
Cooldown: Optional pause between entries (default: false, 3 bars).
Max Entries: Limit pyramiding (default: true, 6 max).
Entries only if both filters pass and direction allowed.
Opposite Signal Handling
Mode: Ignore (default), Reverse (close and enter opposite), or Close (exit only).
Processed before regular entries.
Position Management
Martingale (3 Steps):
Enabled per step (default: all true).
Triggers add-ons at loss levels (defaults: 5%, 8%, 11%) by adding % to position (default: 100% each).
Resets on position close.
Break Even:
Enabled (default: true).
Activates at profit threshold (default: 5%), sets SL better by offset (default: 0.1%).
Exit Systems
Multiple exits checked in sequence.
Exit 1: SL/TP
Enabled: Separate for long/short (default: true).
SL: % from avg price (defaults: 1% long/short).
TP: % from avg price (defaults: 2% long/short).
Exit 2: Funding
Enabled: Separate for long (up) / short (down) (default: true).
Long Exit: Funding > upper exit threshold (default: 0.8%).
Short Exit: Funding < lower exit threshold (default: 0.8%).
Exit 3: nOI
Enabled: Separate for long (up) / short (down) (default: true).
Long Exit: nOI > upper exit (default: 85%).
Short Exit: nOI < lower exit (default: 15%).
Exit 4: Global SL
Enabled: Default true.
Exit: If position loss ≥ % (default: 7%).
Exit 5: Break Even (integrated in position block)
Exit 6: Time Limit
Enabled: Separate for long/short (default: true).
Exit: After N bars in trade (defaults: 30 each).
Timer updates on add-ons if enabled (default: true).
Visual Elements
Buy/Sell Labels: Small labels ("BUY"/"SELL") on bars with signals, limited to last 30.
All indicators plotted on a separate pane (overlay=false).
Usage Notes
Backtesting: Adjust parameters based on asset/timeframe. Test on historical data.
Data Requirements: Works best on crypto perps with OI and funding data.
Risk Management: Incorporates SL/TP and global SL; monitor drawdowns with Martingale.
Customization: All thresholds, enables, and scales are inputs for fine-tuning.
Version: Pine Script v6.
For questions or improvements, contact the author. Happy trading!

Intelligent Currency Breakout ChannelIndicator: Intelligent Currency Breakout Channel
This document provides a detailed explanation of the "Intelligent Currency Breakout Channel" indicator for TradingView.
1. Overview
The Intelligent Currency Breakout Channel is an advanced technical analysis tool designed to identify periods of price consolidation and signal potential breakouts. It automatically draws channels around ranging price action and utilizes sophisticated volume analysis to provide deeper insights into market sentiment. The indicator also includes a built-in logarithmic regression screener to help traders align their breakout signals with the broader market trend.
2. Key Features
Automatic Channel Detection: The indicator identifies periods of low volatility and automatically draws a containing channel (box) around the price action.
Breakout Signals: It generates clear visual alerts (▲ for bullish, ▼ for bearish) when the price closes decisively outside of a channel.
In-Depth Volume Analysis: Within each channel, the indicator plots volume as candlestick-like bars, offering three distinct modes: Total Volume, Buy/Sell Comparison, and Volume Delta. This helps traders gauge the strength and conviction behind price movements.
Real-time Sentiment Gauge: When a channel is active, a dynamic color-graded gauge appears on the right side of the chart. It visualizes the current volume delta momentum relative to its recent range, offering an at-a-glance sentiment reading.
Integrated Trend Screener: A secondary analysis tool based on logarithmic regression is included to determine the underlying trend direction (Up, Down, or Neutral), which can be used to filter breakout signals.
Fully Customizable: Users can extensively customize all parameters, from calculation lengths and breakout sensitivity to the visual appearance of every component.
3. How to Use
Channel Formation: Watch for the indicator to draw a new channel. This signifies that the market is in a consolidation or ranging phase. The formation of a channel itself can be an alertable event.
Volume Interpretation: Observe the volume bars inside the channel. An increase in volume as the price approaches the channel's upper or lower boundary can foreshadow a potential breakout. Use the Volume Display Mode to analyze if buying pressure (Comparison, Delta) or selling pressure is building.
Breakout Confirmation: A bullish breakout signal (▲) appears when the price closes above the channel's upper boundary. A bearish breakout signal (▼) appears when the price closes below the lower boundary. For higher-quality signals, enable the Strong Closes Only option.
Trend Confirmation (Screener): Use the screener's plot and background color to confirm the broader trend. For instance, you might choose to only take bullish breakout signals when the screener indicates an uptrend (green background) and bearish signals when it indicates a downtrend (red background).
Sentiment Gauge: The pointer on the gauge indicates current momentum. A pointer in the upper (green) section suggests bullish pressure, while a pointer in the lower (red) section suggests bearish pressure. This can provide additional confluence for a trade decision.
4. Settings and Inputs
Main Settings
Overlap Channels: If enabled, allows multiple channels to be drawn on the chart simultaneously, even if they overlap. When disabled, a new channel will only form if it doesn't intersect with an existing one.
Strong Closes Only: If enabled, a breakout is only triggered if the midpoint of the candle's body (average of open and close) is outside the channel. This helps filter out false signals caused by long wicks. If disabled, any close outside the channel triggers a breakout.
Normalization Length: The lookback period (in bars) used for price normalization. A higher value creates a more stable normalization but may be slower to react to recent price changes.
Box Detection Length: The lookback period used to detect the channel formation pattern. A lower value will result in more frequent channels but may be more sensitive to noise. A higher value will result in fewer, but potentially more significant, channels.
Volume Analysis
Show Volume Analysis: Toggles the visibility of the candlestick-like volume bars inside the channel.
Volume Display Mode:
Volume: Displays total volume as symmetrical bars around the channel's midline.
Comparison: Shows buying volume (green) above the midline and selling volume (red) below it.
Delta: Shows the net difference between buying and selling volume. Positive delta is shown above the midline, and negative delta is shown below.
Volume Delta Timeframe Source: The timeframe from which to source volume data for calculations. Using a lower timeframe can provide a more granular view of volume dynamics.
Volume Scaling: A multiplier that adjusts the vertical size of the volume bars relative to the channel's height.
Appearance
Volume Text Size: Sets the size of the volume data text displayed in the corners of the channel. Options: Tiny, Small, Medium, Large.
Bullish Color: The primary color for all bullish visual elements, including breakout signals and positive volume bars.
Bearish Color: The primary color for all bearish visual elements, including breakout signals and negative volume bars.
Screener Settings
Lookback Period: The number of bars used for the logarithmic regression calculation to determine the trend.
Screener Type:
Log Regression Channel: The signal is based on the slope of the entire regression channel over the lookback period. An upward sloping channel is bullish (1), and a downward sloping one is bearish (-1).
Logarithmic Regression: The signal is based on the most recent value of the regression line compared to its value 3 bars ago. This provides a more responsive measure of the immediate trend.
5. Alerts
You can set up the following alerts through the TradingView alerts panel:
New Channel Formed: Triggers when a new price consolidation channel is detected and drawn on the chart.
Bullish Breakout: Triggers when the price breaks out and closes above the upper boundary of a channel.
Bearish Breakout: Triggers when the price breaks out and closes below the lower boundary of a channel.
Is In Channel: Triggers on every bar that the price is currently trading inside an active channel.
Signal UP: Triggers when the Screener's signal turns bullish (1).
Signal DOWN: Triggers when the Screener's signal turns bearish (-1).

Bondar Drive v2.1Title: Bondar Drive v2.1 — Real-time print and delta tick volume visualization
Description:
Bondar Drive v2.1 is a tool for visualizing real-time order flow data. It highlights price movements and volume deltas in an intuitive, easy-to-read format. Indicator can be used in conjunction with the Anchored Volume Profile and Volume Footprint (Type: Total).
Features:
Real-Time Print Visualization:
Displays order flow prints with delta colors for buy/sell dominance.
Adjustable size and transparency for varying order thresholds.
Volume Delta Analysis:
Categorizes orders into Tiny, Small, Session, Large, and Huge based on user-defined thresholds.
Provides a tooltip showing order time and price.
Customizable Time Range:
Keeps prints visible for a specified duration (in seconds).
Flexible User Inputs:
Adjustable time zones, print sizes, starting bar index, and volume thresholds.
Visual Enhancements:
Line connections between prints show progression of orders and market direction.
How It Works:
The indicator gathers volume delta and price data in real time.
It dynamically displays circular labels with varying sizes and colors, reflecting the size and type of orders. Labels and lines are automatically removed after the specified time range, ensuring a clean and uncluttered chart.
Customization Options:
Number of Prints: Control how many prints are displayed.
Order Size Filters: Exclude small trades to highlight significant orders.
Color Options: Customize print colors, text, and connecting lines.
Time Offset: Adjust for your local time zone.
Use Cases:
Identify order flow imbalances and price levels dominated by buyers or sellers.
Track the progression of large orders for better trade execution.
Spot market reversals and momentum shifts using real-time prints and delta.

Volume Profile DeltaMap [MHA Finverse]Volume Profile DeltaMap with Session Analysis
SHORT DESCRIPTION (for listing)
Advanced Volume Profile indicator with Delta Analysis, Value Area, Volume Nodes, Imbalance Zones, and Multi-Session Profiles. Professional tool for institutional-style volume analysis and market structure understanding.
---
DETAILED DESCRIPTION
📊 OVERVIEW
The Volume Profile DeltaMap is a comprehensive institutional-grade indicator that visualizes volume distribution across price levels, revealing where the most significant trading activity occurred. Unlike traditional indicators that plot data over time, Volume Profile analyzes price levels to identify key support/resistance zones, equilibrium areas, and buyer/seller dominance.
This indicator combines multiple advanced features:
- Volume Profile Analysis with customizable bins
- Delta Heat Map showing buyer vs seller pressure
- Value Area (VAH/VAL) calculations
- High/Low Volume Node Detection
- Imbalance Zone Identification
- Multi-Session Profile Separation (Tokyo, London, NY, Sydney)
- Point of Control (POC) highlighting
---
🎯 KEY FEATURES
1. Volume Profile Core
- Divides price range into customizable bins (10-100 levels)
- Accumulates volume at each price level over a lookback period
- Displays volume distribution horizontally on the chart
- Configurable lookback period (default: 200 bars)
2. Delta Analysis & Heat Map
- Delta (Δ) : Measures the difference between buying and selling pressure
- Color-coded visualization :
- Green/Teal = Buyer dominance
- Red/Pink = Seller dominance
- Heat map intensity : Shows volume concentration with gradient colors
- Percentage labels : Displays exact buyer/seller ratios at each level
3. Point of Control (POC)
- Automatically identifies the price level with maximum volume
- Marked with cyan border and volume label
- Acts as a strong magnetic level where price tends to return
- Often serves as major support/resistance
4. Value Area (VAH/VAL)
- Value Area : Price range containing 70% of total volume (configurable 50-90%)
- VAH (Value Area High) : Upper boundary - resistance level
- VAL (Value Area Low) : Lower boundary - support level
- Displayed with dashed lines and labels
- Represents fair value zone where institutional traders are most active
5. Volume Nodes
- HVN (High Volume Nodes) : Areas with ≥80% of maximum volume
- Highlighted in yellow/amber
- Strong support/resistance zones
- Price tends to consolidate here
- LVN (Low Volume Nodes) : Areas with ≤30% of maximum volume
- Highlighted in orange
- Low liquidity gaps
- Price moves quickly through these zones
- Potential breakout areas
6. Imbalance Zones
- Identifies areas with extreme directional bias (≥70% threshold)
- Buy Imbalance : Green overlay - exhaustion of buying pressure
- Sell Imbalance : Red overlay - exhaustion of selling pressure
- Indicates potential reversal or continuation zones
7. Session-Based Analysis
- Session Background Overlay : Color-codes current trading session
- Separate Session Profiles : Creates individual volume profiles for:
- 🇯🇵 Tokyo Session (00:00-09:00)
- 🇬🇧 London Session (07:00-16:00)
- 🇺🇸 New York Session (13:00-22:00)
- 🇦🇺 Sydney Session (21:00-06:00)
- Compare volume patterns across different market sessions
- Identify session-specific support/resistance levels
---
⚙️ CONFIGURATION SETTINGS
Basic Settings
- LookBack : Number of bars to analyze (50-500 recommended)
- Bins : Number of price levels (10-100, default: 30)
- Horizontal Offset : Adjust profile position on chart
#### Features Toggle
- Delta Heat Map
- Delta Labels
- Volume Bars (Buy/Sell split)
- POC Line
- Custom colors for positive/negative volume
Advanced Features
- Value Area calculation with adjustable percentage
- Volume Nodes (HVN/LVN) with custom thresholds
- Imbalance Zones with adjustable sensitivity
- Session backgrounds and separate profiles
- Profile spacing for multi-session view
---
📈 HOW TO USE THIS INDICATOR
Installation & Setup
1. Add to Chart :
- Search for "Volume Profile DeltaMap"
- Click "Add to favorites" ⭐
- Apply to your chart
2. Recommended Timeframes :
- Scalping : 1-5 minute charts
- Day Trading : 5-15 minute charts
- Swing Trading : 1-4 hour charts
- Position Trading : Daily charts
3. Initial Settings :
- Start with default settings
- For intraday: Set LookBack to 200-400 bars
- For higher timeframes: Use 100-200 bars
4. Enable Session Profiles (Optional):
- Go to Settings → Advanced Features
- Enable "Separate Profiles Per Session"
- Adjust "Profile Spacing" for better visibility
---
🔍 READING THE INDICATOR
Understanding the Display
Main Profile Elements:
- Horizontal bars : Length represents volume at that price
- Color gradient : Shows delta (buyer vs seller dominance)
- Bright cyan line : Point of Control (POC) - highest volume
- Green dashed line : Value Area High (VAH)
- Red dashed line : Value Area Low (VAL)
- Yellow highlights : High Volume Nodes (HVN)
- Orange highlights : Low Volume Nodes (LVN)
Volume Bars (if enabled):
- Top half (Red) : Selling volume percentage
- Bottom half (Teal) : Buying volume percentage
Delta Labels:
- Shows Δ percentage
- Positive = More buyers
- Negative = More sellers
---
📊 MARKET ANALYSIS & TRADING STRATEGIES
1. Support & Resistance Trading
POC as Key Level:
- Price tends to return to POC (magnetic effect)
- Strategy :
- When price is above POC → Look for pullbacks to POC for long entries
- When price is below POC → Look for rallies to POC for short entries
- POC acts as dynamic support/resistance
Value Area Trading:
- Inside Value Area (between VAH & VAL):
- Market is in balance/equilibrium
- Range-bound trading strategies
- Look for mean reversion
- Outside Value Area :
- Price accepted above VAH = Bullish breakout
- Price accepted below VAL = Bearish breakdown
- Trend-following strategies
Example Setup:
Price above VAH + Strong buying delta = Bullish trend
→ Wait for pullback to VAH
→ Enter long with stop below VAH
→ Target: Next HVN or previous session high
2. Volume Node Trading
High Volume Nodes (HVN):
- Characteristics : Strong support/resistance, consolidation zones
- Trading Strategy :
- Price approaching HVN from above → Potential support
- Price approaching HVN from below → Potential resistance
- Breakout from HVN → Strong momentum move
- Setup : Place limit orders at HVN boundaries
Low Volume Nodes (LVN):
- Characteristics : Low liquidity, fast price movement
- Trading Strategy :
- Price in LVN = Don't chase, wait for next HVN
- LVN breakout = Rapid moves, use wider stops
- Price rejection from LVN = Quick return to HVN
- Setup : Avoid placing stops in LVN zones
Example:
Price consolidating at HVN (yellow) near $50,000
→ Breakout above with volume
→ Fast move through LVN (orange) gap
→ Next target: Upper HVN at $51,500
3. Delta Analysis for Entry Timing
Strong Buying Delta (Green zones):
- Δ > +20% = Buyers in control
- Bullish Signal : Accumulation zone
- Strategy : Look for long entries on pullbacks
- Confirmation : Rising price + positive delta
Strong Selling Delta (Red zones):
- Δ < -20% = Sellers in control
- Bearish Signal : Distribution zone
- Strategy : Look for short entries on rallies
- Confirmation : Falling price + negative delta
Delta Divergence (Advanced):
- Bullish Divergence : Price making lower lows, but delta improving (less negative)
- Indicates selling pressure weakening
- Potential reversal signal
- Bearish Divergence : Price making higher highs, but delta weakening (less positive)
- Indicates buying pressure exhausting
- Potential reversal signal
4. Imbalance Zone Trading
Buy Imbalance (Bright Green):
- 70%+ buying pressure
- Interpretation :
- Potential exhaustion of buyers
- Smart money distribution
- Strategy :
- Look for reversal signals (bearish candles, resistance)
- Take profits on long positions
- Consider short entries with confirmation
Sell Imbalance (Bright Red):
- 70%+ selling pressure
- Interpretation :
- Potential exhaustion of sellers
- Smart money accumulation
- Strategy :
- Look for reversal signals (bullish candles, support)
- Take profits on short positions
- Consider long entries with confirmation
Example:
```
Price at VAH with 80% sell imbalance
→ Selling exhaustion likely
→ Wait for bullish reversal candle
→ Enter long with stop below VAL
```
5. Multi-Session Analysis
When "Separate Profiles Per Session" is enabled:
Session-Specific Levels:
- Each session creates its own POC and value area
- Compare sessions to identify:
- Where institutions accumulated/distributed
- Which levels each session respected
- Unfinished business from previous sessions
Trading Strategies:
A. Session POC Confluence
London POC: $49,500
NY POC: $49,550
→ Strong support zone at $49,500-$49,550
→ High probability long setup on pullback
B. Value Area Overlap
London VAH: $50,000
NY VAL: $49,800
→ Overlap creates strong consolidation zone
→ Breakout strategy: Enter on break above $50,000
C. Unfinished Business
London session rejected $51,000 (sell imbalance)
NY session hasn't tested this level yet
→ Watch for NY session to revisit $51,000
→ Potential reversal zone
D. Session Handoff
Tokyo session: Sideways, low volume
London session: Strong buying delta, break above VAH
NY session: Continuation or reversal?
→ Monitor NY open for direction confirmation
6. Market Profile Analysis
Profile Shape Interpretation:
A. P-Shape (Peak at Top)
- High volume at top of range
- Interpretation : Distribution, potential reversal down
- Strategy : Look for shorts at resistance
B. b-Shape (Peak at Bottom)
- High volume at bottom of range
- Interpretation : Accumulation, potential reversal up
- Strategy : Look for longs at support
C. D-Shape (Peak in Middle)
- Balanced profile, POC in center
- Interpretation : Equilibrium, neutral market
- Strategy : Range trading between VAH/VAL
D. Thin Profile (LVN Gap)
- Low volume throughout
- Interpretation : Trending market, little acceptance
- Strategy : Trend following, avoid counter-trend trades
---
🎯 COMPLETE TRADING WORKFLOW
Step 1: Market Structure Analysis
1. Identify overall profile shape
2. Locate POC, VAH, VAL
3. Note HVN and LVN zones
4. Check current price position relative to value area
Step 2: Delta & Imbalance Check
1. Review delta distribution (where are buyers/sellers?)
2. Identify imbalance zones
3. Look for delta divergences
4. Note any exhaustion signals
Step 3: Session Analysis (if enabled)
1. Compare current session vs previous sessions
2. Identify key levels each session created
3. Look for level confluences or gaps
4. Note unfinished business
Step 4: Trade Setup
1. Define your bias (long/short/neutral)
2. Identify entry zone (HVN, VAH/VAL, POC)
3. Set stop loss (below/above key level or opposite LVN)
4. Set target (next HVN, VAH/VAL, or session high/low)
Step 5: Execution & Management
1. Wait for price to reach entry zone
2. Confirm with price action (candlestick patterns)
3. Enter trade with defined risk
4. Move stop to breakeven at first target
5. Trail stop or take profits at resistance/support
---
📋 EXAMPLE TRADE SCENARIOS
Scenario 1: Long Setup at VAL
Setup:
- Price pulled back to VAL ($49,200)
- VAL coincides with HVN (yellow zone)
- Delta showing +15% buying (green)
- London session POC also at $49,200
Entry:
- Buy at $49,200 (VAL/HVN confluence)
- Stop loss: $49,000 (below VAL, in LVN)
- Target 1: $49,800 (POC)
- Target 2: $50,200 (VAH)
Management:
- Move stop to breakeven when Target 1 reached
- Trail stop below recent swing lows
- Exit 50% at VAH, let remainder run
Risk:Reward : 200 points risk / 1000 points potential = 1:5 R:R
---
Scenario 2: Short Setup at Sell Imbalance
Setup:
- Price at VAH ($50,500)
- Sell imbalance zone (85% sellers, bright red)
- Bearish divergence (higher high, weaker delta)
- Previous session rejected this level
Entry:
- Short at $50,500 after bearish engulfing candle
- Stop loss: $50,750 (above VAH + imbalance zone)
- Target 1: $50,000 (POC)
- Target 2: $49,600 (VAL)
Management:
- Take 50% profit at POC
- Trail stop above recent swing highs
- Exit remainder at VAL or if delta turns positive
Risk:Reward : 250 points risk / 900 points potential = 1:3.6 R:R
---
Scenario 3: Range Trading Inside Value Area
Setup:
- Market consolidating between VAH ($50,200) and VAL ($49,600)
- POC at $49,900
- Multiple HVNs creating range boundaries
- Delta oscillating between +/-10%
Long Trade:
- Entry: $49,650 (near VAL)
- Stop: $49,500 (below VAL)
- Target: $50,150 (near VAH)
- Risk:Reward: 150/500 = 1:3.3
Short Trade:
- Entry: $50,150 (near VAH)
- Stop: $50,300 (above VAH)
- Target: $49,700 (near VAL)
- Risk:Reward: 150/450 = 1:3
Management:
- Reduce position size in range trading
- Take profits at opposite boundary
- Exit if breakout occurs (stop hunt possible)
---
Scenario 4: Session Breakout Trade
Setup:
- London session: Range-bound $49,500-$50,000
- London VAH at $50,000 (resistance)
- NY session opens: Strong buying delta (+35%)
- Price breaks above $50,000 with momentum
Entry:
- Buy on breakout above $50,000
- Or buy on retest of $50,000 (old resistance = new support)
- Stop loss: $49,700 (below breakout level + buffer)
- Target 1: $50,500 (next HVN from previous day)
- Target 2: $51,000 (measured move)
Management:
- Enter 50% position on breakout
- Add remaining 50% on successful retest
- Move stop to breakeven when price +$300
- Trail stop below 20 EMA or recent higher lows
Risk:Reward : 300 points risk / 1000 points potential = 1:3.3 R:R
---
⚠️ BEST PRACTICES & RISK MANAGEMENT
Do's:
✅ Use on liquid markets (major crypto, forex, indices)
✅ Combine with price action and candlestick patterns
✅ Wait for confirmation before entering trades
✅ Always use stop losses based on volume structure
✅ Take partial profits at key levels (HVN, VAH/VAL)
✅ Adjust lookback period based on timeframe
✅ Use higher timeframe profiles for context
✅ Compare current profile with previous day/session
✅ Consider volume trends (increasing/decreasing)
✅ Backtest strategies on your specific market
Don'ts:
❌ Don't trade solely based on this indicator
❌ Don't ignore price action and market context
❌ Don't place stops in LVN zones (prone to spikes)
❌ Don't chase price in low volume areas
❌ Don't overtrade - wait for quality setups
❌ Don't use on extremely low volume/illiquid assets
❌ Don't forget to adjust for different market conditions
❌ Don't ignore fundamental news events
❌ Don't use excessive leverage even with good setups
❌ Don't force trades - patience is key
Risk Management Rules:
1. Risk per trade : Never risk more than 1-2% of capital
2. Position sizing : Based on stop loss distance
3. Stop placement : Always below/above key volume levels
4. Profit taking : Scale out at multiple targets
5. Drawdown limits : Stop trading after 3 consecutive losses
6. Win rate expectation : 50-60% is realistic
7. Risk:Reward minimum : Aim for 1:2 or better
8. Correlation : Don't take correlated positions
---
🔧 TROUBLESHOOTING & OPTIMIZATION
If profiles look too compressed:
- Increase "Bins" to 40-50
- Reduce "LookBack" period
- Adjust "Horizontal Offset"
If too cluttered:
- Disable "Delta Labels"
- Disable "Volume Bars"
- Keep only POC and Value Area
- Use "Session Background Overlay" instead of separate profiles
For scalping (1-5 min):
- LookBack: 300-500 bars
- Bins: 20-30
- Enable separate session profiles
- Focus on imbalance zones
For swing trading (1H-4H):
- LookBack: 100-200 bars
- Bins: 25-35
- Focus on VAH/VAL and HVN
- Disable session features
For position trading (Daily):
- LookBack: 50-100 bars
- Bins: 30-40
- Focus on weekly/monthly POC
- Compare with previous week profiles
---
📚 ADVANCED CONCEPTS
1. Composite Profiles
- Build profiles across multiple days
- Increase LookBack to 500+ bars on 15-min chart
- Identifies major support/resistance from weeks of data
- Use for swing trading key levels
2. Profile Migration
- Track how POC moves day over day
- Uptrend : POC migrating higher
- Downtrend : POC migrating lower
- Range : POC oscillating in same area
3. Failed Auctions
- Price briefly leaves value area but quickly returns
- Failed auction high : Bearish signal
- Failed auction low : Bullish signal
- Indicates rejection of new price levels
4. Overnight Inventory
- Compare previous day's close to value area
- Close above VAH : Bullish bias for next day
- Close below VAL : Bearish bias for next day
- Close in value area : Neutral, range expected
5. Volume Delta Momentum
- Track cumulative delta across time
- Rising cumulative delta + rising price : Strong trend
- Falling cumulative delta + rising price : Weak/topping
- Rising cumulative delta + falling price : Potential reversal
---
📊 INTEGRATION WITH OTHER INDICATORS
Complementary Indicators:
1. Moving Averages (20/50/200 EMA)
- Use with POC and VAH/VAL
- Confluence with EMAs = stronger levels
2. RSI/Stochastic
- Overbought at resistance (VAH/HVN) = strong short
- Oversold at support (VAL/HVN) = strong long
3. VWAP
- POC often aligns with VWAP
- Deviation from VWAP + Volume Profile = trade setup
4. Order Flow/Footprint Charts
- Confirm delta analysis
- Detailed buyer/seller pressure
5. Market Profile (TPO)
- Similar concept, different visualization
- Use together for complete picture
Example Multi-Indicator Setup:
Price at VAL ✓
+ 200 EMA support ✓
+ RSI oversold (30) ✓
+ Positive delta zone ✓
+ Bullish engulfing candle ✓
= High probability long entry
---
🎓 LEARNING CURVE & PRACTICE
Week 1-2: Understanding
- Study each feature individually
- Identify POC, VAH, VAL on historical charts
- Note HVN and LVN patterns
- Observe how price reacts to these levels
Week 3-4: Pattern Recognition
- Track different profile shapes
- Identify session-specific patterns
- Note delta distribution patterns
- Document imbalance zone outcomes
Week 5-6: Paper Trading
- Take simulated trades based on setups
- Record entry/exit reasoning
- Track win rate and R:R
- Refine strategy based on results
Week 7-8: Live Trading (Small Size)
- Start with minimal position sizes
- Focus on execution and discipline
- Build confidence with real money
- Gradually increase size as proficiency grows
Ongoing:
- Review trades weekly
- Keep trading journal
- Adapt to changing market conditions
- Continuously refine strategy
---
💡 KEY TAKEAWAYS
1. Volume Profile shows WHERE the market is most active (POC, HVN)
2. Delta shows WHO is in control (buyers vs sellers)
3. Value Area shows FAIR VALUE (equilibrium zone)
4. Volume Nodes show STRUCTURE (support/resistance)
5. Imbalances show EXHAUSTION (potential reversals)
6. Sessions show PARTICIPATION (institutional activity)
The indicator is a MAP, not a SIGNAL:
- It shows you the battlefield terrain
- You still need to decide when/how to engage
- Combine with price action for best results
- Risk management is always paramount
---
⚖️ DISCLAIMER
This indicator is for educational and informational purposes only.
- Not financial advice
- Past performance does not guarantee future results
- Trading involves substantial risk of loss
- Only trade with capital you can afford to lose
- Always do your own research and due diligence
- Test strategies thoroughly before risking real money
- Consider consulting a licensed financial advisor
The creator is not responsible for any trading losses incurred while using this indicator.
---
Happy Trading! 📈🚀

Project SynthIntroducing Project Synth !
Inspired by Pace of Tape and Cumulative Delta I created Project Synth in order to aggregate volume flow data across multiple marketsfor two primary reasions:
Traditional orderflow tools are not available on Tradingview. My script attempts to bring an original; calculus-based approach to creating not only an alternative for traditional orderflow tools, but also a more accurate one.
In order to detect genuine buying and selling pressure that cannot be easily manipulated. I did this because while I've always enjoyed concept behind both of those tools, I did not think they captured enough data to be useful. By analyzing assets that move together (positive correlation) and assets that move inversely (negative correlation), my system aims to fix the fundamental problems with those indicators and create an objective view of market sentiment based on aggregate orderflow.
Some more detailed explanations (using QQQ and SQQQ as an example):
Inverse Market Dynamics (QQQ vs SQQQ):
In an inverse market like SQQQ, aggressive buyers hit the ask when they expect the underlying (QQQ) to fall, while passive buyers wait on the bid hoping for cheaper inverse exposure. When QQQ rallies, SQQQ sees aggressive selling (people dumping their bearish bets) hitting bids, while passive sellers sit on the ask hoping to exit at better prices. The aggression flows opposite to the underlying market direction.
Why Utilizing Both Markets Provides A More Accurate Delta:
Watching both QQQ and SQQQ gives cross-validation - real buying pressure in QQQ should coincide with selling pressure in SQQQ. If you see buying in QQQ but also buying in SQQQ, that's a conflicting signal suggesting the move might be artificial or driven by other factors. The inverse relationship acts as a confirmation filter, making false signals much harder to generate.
Multiple Markets = Authentic Pressure:
The more unique, important markets you track, the harder it becomes to create fake delta moves. Real institutional buying/selling pressure affects multiple correlated assets simultaneously in predictable patterns - you can't easily manipulate tech stocks, treasury bonds, VIX, and currency pairs all at once to create a false signal. Each additional market acts as a fraud detection layer, ensuring the delta measurement reflects genuine ecosystem-wide buying and selling pressure rather than isolated manipulation or noise.
My Suggestions For Usage:
In order to keep the explanation simple and short for now, I suggest using it just like a cumulative delta indicator. For example: let's say you were watching CME_MINI:ES1! , and you had a resistance level at 6000. When the price reaches your resistance level, you would be looking for a significant divergence between price and Delta. Price : rising, Delta : falling. This means that even though the price was going up, strong and aggressive sellers are jumping in more and more, this can be used as a confirmation tool for a resistance level.
Notes For Moderators, Authors and Users:
Firstly, to the best of my knowledge, I have not been able to find many tools built around the concept of cumulative delta or pace of tape. While I know there are a couple projects, none to the magnitude of synthetically recreating these tools via an algorithm designed around basic calculus principles. While tools like Volume Delta are built in, they do not attempt to capture an accurate picture of aggregated orderflow from what I understand.
Secondly, it needs to be noted that tool aims to create an approximation of buying and selling pressure. To my knowledge it is not possible to create an accurate full picture, at least not within the limitations of Tradingview.

Realtime FootprintThe purpose of this script is to gain a better understanding of the order flow by the footprint. To that end, i have added unusual features in addition to the standard features.
I use "Real Time 5D Profile by LucF" main engine to create basic footprint(profile type) and added some popular features and my favorites.
This script can only be used in realtime, because tradingview doesn't provide historical Bid/Ask date.
Bid/Ask date used this script are up/down ticks.
This script can only be used by time based chart (1m, 5m , 60m and daily etc)
This script use many labels and these are limited max 500, so you can't display many bars.
If you want to display foot print bars longer, turn off the unused sub-display function.
Default setting is footprint is 25 labels, IB count is 1, COT high and Ratio high is 1, COT low and Ratio low is 1 and Delta Box Ratio Volume is 1 , total 29.
plus UA , IB stripes , ladder fading mark use several labels.
///////// General Setting ///////////
Resets on Volume / Range bar
: If you want to use simple time based Resets on, please set Total Volume is 0.
Your timeframe is always the first condition. So if you set Total Volume is 1000, both conditions(Volume >= 1000 and your timeframe start next bar) must be met. (that is, new footprint bar doesn't start at when total volume = exactly 1000).
Ticks per row and Maximum row of Bar
: 1 is minimum size(tick). "Maximum row of Bar" decide the number of rows used in one footprint. 1 row is created from 1 label, so you need to reduce this number to display many footprints (Max label is 500).
Volume Filter and For Calculation and Display
: "Volume Filter" decide minimum size of using volume for this script.
"For Calculation and Display" is used to convert volume to an integer.
This script only use integer to make profile look better (I contained Bid number and Ask number in one row( one label) to saving labels. This require to make no difference in width by the number of digits and this script corresponds integers from 0 to 3 digits).
ex) Symbol average volume size is from 0.0001 to 0.001. You decide only use Volume >= 0.0005 by "Volume Filter".
Next, you convert volume to integer, by setting "For Calculation and Display" is 1000 (0.0005 * 1000 = 5).
If 0.00052 → 5.2 → 5, 0.00058 → 5.8 → 6 (Decimal numbers are rounded off)
This integer is used to all calculation in this script.
//////// Main Display ///////
Footprint, Total, Row Delta, Diagonal Delta and Profile
: "Footprint" display Ask and Bid per row. "Total" display Ask + Bid per row.
"Row Delta" display Ask - Bid per row. "Diagonal Delta" display Ask(row N) - Bid(row N -1) per row.
Profile display Total Volume(Ask + Bid) per row by using Block. Profile Block coloring are decided by Row Delta value(default: positive Row Delta (Ask > Bid) is greenish colors and negative Row Delta (Ask < Bid) is reddish colors.)
Volume per Profile Block, Row Imbalance Ratio and Delta Bull/Bear/Neutral Colors
: "Volume per Profile Block" decide one block contain how many total volume.
ex) When you set 20, Total volume 70 display 3 block.
The maximum number of blocks that can be used per low is 20.
So if you set 20, Total volume 400 is 20 blocks. total volume 800 is 20 blocks too.
"Row Imbalance Ratio" decide block coloring. The row imbalance is that the difference between Ask and Bid (row delta) is large.
default is x3, x2 and x1. The larger the difference, the brighter the color.
ex) Ask 30 Bid 10 is light green. Ask 20 Bid 10 is green. Ask 11 Bid 10 is dark green.
Ask 0 Bid 1 is light red. Ask 1 Bid 2 is red. ask 30 Bid 59 is dark green.
Ask 10 Bid 10 is neutral color(gray)
profile coloring is reflected same row's other elements(Ask, Bid, Total and Delta) too.
It's because one label can only use one text color.
/////// Sub Display ///////
Delta, total and Commitment of Traders
: "Delta" is total Ask - total Bid in one footprint bar. Total is total Ask + total Bid in one footprint bar.
"Commitment of traders" is variation of "Delta". COT High is reset to 0 when current highest is touched. COT Low is opposite.
Basic concept of Delta is to compare price with Delta. Ordinary, when price move up, delta is positive. Price move down is negative delta.
This is because market orders move price and market orders are counted by Delta (although this description is not exactly correct).
But, sometimes prices do not move even though many market orders are putting pressure on price , or conversely, price move strongly without many market orders.
This is key point. Big player absorb market orders by iceberg order(Subdivide large orders and pretend to be small limit orders.
Small limit orders look weak in the order book, but they are added each time you fill, so they are more powerful than they look.), so price don't move.
On the other hand, when the price is moving easily, smart players may be aiming to attract and counterattack to a better price for them.
It's more of a sport than science, and there's always no right response. Pay attention to the relationship between price, volume and delta.
ex) If COT Low is large negative value, it means many sell market orders is coming, but iceberg order is absorbing their attack at limit order.
you should not do buy entry, only this clue. but this is one of the hints.
"Delta, Box Ratio and Total texts is contained same label and its color are "Delta" coloring. Positive Delta is Delta Bull color(green),Negative Delta is Delta Bear Color
and Delta = 0 is Neutral Color(gray). When Delta direction and price direction are opposite is Delta Divergence Color(yellow).
I didn't add the cumulative volume delta because I prefer to display the CVD line on the price chart rather than the number.
Box Ratio , Box Ratio Divisor and Heavy Box Ratio Ratio
: This is not ordinary footprint features, but I like this concept so I added.
Box Ratio by Richard W. Arms is simple but useful tool. calculation is "total volume (one bar) divided by Bar range (highest - lowest)."
When Bull and bear are fighting fiercely this number become large, and then important price move happen.
I made average BR from something like 5 SMA and if current BR exceeds average BR x (Heavy Box Ratio Ratio), BR box mark will be filled.
Box Ratio Divisor is used to good looking display(BR multiplied by Box Ratio Divisor is rounded off and displayed as an integer)
Diagonal Imbalance Count , D IB Mark and D IB Stripes
: Diagonal Imbalance is defined by "Diagonal Imbalance Ratio".
ex) You set 2. When Ask(row N) 30 Bid(row N -1)10, it's 30 > 10*2, so positive Diagonal Imbalance.
When Ask(row N) 4 Bid(row N -1)9, it's 4*2 < 9, so negative Diagonal Imbalance.
This calculation does not use equals to avoid Ask(row N) 0 Bid(row N -1)0 became Diagonal Imbalance.
Ask(row N) 0 Bid(row N -1)0, it's 0 = 0*2, not Diagonal Imbalance. Ask(row N) 10 Bid(row N -1)5, it's 10 = 5*2, not Diagonal Imbalance.
"D IB Mark" emphasize Ask or Bid number which is dominant side(Winner of Diagonal Imbalance calculation), by under line.
"Diagonal Imbalance Count" compare Ask side D IB Mark to Bid side D IB Mark in one footprint.
Coloring depend on which is more aggressive side (it has many IB Mark) and When Aggressive direction and price direction are opposite is Delta Divergence Color(yellow).
"D IB Stripes" is a function that further emphasizes with an arrow Mark, when a DIB mark is added on the same side for three consecutive row. Three consecutive arrow is added at third row.
Unfinished Auction, Ratio Bounds and Ladder fading Mark
: "Unfinished Auction" emphasize highest or lowest row which has both Ask and Bid, by Delta Divergence Color(yellow) XXXXXX mark.
Unfinished Auction sometimes has magnet effect, price may touch and breakout at UA side in the future.
This concept is famous as profit taking target than entry decision.
But, I'm interested in the case that Big player make fake breakout at UA side and trapped retail traders, and then do reversal with retail traders stop-loss hunt.
Anyway, it's not stand alone signal.
"Ratio Bounds" gauge decrease of pressure at extreme price. Ratio Bounds High is number which second highest ask is divided by highest ask.
Ratio Bounds Low is number which second lowest bid is divided by lowest bid. The larger the number, the less momentum the price has.
ex)first footprint bar has Ratio Bounds Low 2, second footprint bar has RBL 4, third footprint bar has RBL 20.
This indicates that the bear's power is gradually diminishing.
"Ladder fading mark" emphasizes the decrease of the value in 3 consecutive row at extreme price. I added two type Marks.
Ask/Bid type(triangle Mark) is Ask/Bid values are decreasing of three consecutive row at extreme price.
Row Imbalance type(Diamond Mark) are row Imbalance values are decreasing of three consecutive row at extreme price.
ex)Third lowest Bid 40, second lowest Bid 10 and lowest Bid 5 have triangle up Mark. That is bear's power is gradually diminishing.
(This Mark only check Bid value at lowest price and Ask value at highest price).
Third highest row delta + 60, second highest row delta + 5, highest delta - 20 have diamond Mark. That is Bull's power is gradually diminishing.
Sub display use Delta colors at bottom of Sub display section.
////// Candle & POC /////////
candle and POC
: Ordinary, "POC" Point of Control is row of largest total volume, but this script'POC is volume weighted average.
This is because the regular POC was visually displayed by the profile ,and I was influenced LucF's ideas.
POC coloring is decided in relation to the previous POC. When current POC is higher than previous POC, color is UP Bar Color(green).
In the opposite case, Down Bar color is used.
POC Divergence Color is used when Current POC is up but current bar close is lower than open (Down price Bar),or in the opposite case.
POC coloring has option also highlight background by Delta Divergence Color(yellow). but bg color is displayed at your time frame current price bar not current footprint bar.
The basic explanation is over.
I add some image to promote understanding basic ideas.

Market Outlook Score (MOS)Overview
The "Market Outlook Score (MOS)" is a custom technical indicator designed for TradingView, written in Pine Script version 6. It provides a quantitative assessment of market conditions by aggregating multiple factors, including trend strength across different timeframes, directional movement (via ADX), momentum (via RSI changes), volume dynamics, and volatility stability (via ATR). The MOS is calculated as a weighted score that ranges typically between -1 and +1 (though it can exceed these bounds in extreme conditions), where positive values suggest bullish (long) opportunities, negative values indicate bearish (short) setups, and values near zero imply neutral or indecisive markets.
This indicator is particularly useful for traders seeking a holistic "outlook" score to gauge potential entry points or market bias. It overlays on a separate pane (non-overlay mode) and visualizes the score through horizontal threshold lines and dynamic labels showing the numeric MOS value along with a simple trading decision ("Long", "Short", or "Neutral"). The script avoids using the plot function for compatibility reasons (e.g., potential TradingView bugs) and instead relies on hline for static lines and label.new for per-bar annotations.
Key features:
Multi-Timeframe Analysis: Incorporates slope data from 5-minute, 15-minute, and 30-minute charts to capture short-term trends.
Trend and Strength Integration: Uses ADX to weight trend bias, ensuring stronger signals in trending markets.
Momentum and Volume: Includes RSI momentum impulses and volume deviations for added confirmation.
Volatility Adjustment: Factors in ATR changes to assess market stability.
Customizable Inputs: Allows users to tweak periods for lookback, ADX, and ATR.
Decision Labels: Automatically classifies the MOS into actionable categories with visual labels.
This indicator is best suited for intraday or swing trading on volatile assets like stocks, forex, or cryptocurrencies. It does not generate buy/sell signals directly but can be combined with other tools (e.g., moving averages or oscillators) for comprehensive strategies.
Inputs
The script provides three user-configurable inputs via TradingView's input panel:
Lookback Period (lookback):
Type: Integer
Default: 20
Range: Minimum 10, Maximum 50
Purpose: Defines the number of bars used in slope calculations for trend analysis. A shorter lookback makes the indicator more sensitive to recent price action, while a longer one smooths out noise for longer-term trends.
ADX Period (adxPeriod):
Type: Integer
Default: 14
Range: Minimum 5, Maximum 30
Purpose: Sets the smoothing period for the Average Directional Index (ADX) and its components (DI+ and DI-). Standard value is 14, but shorter periods increase responsiveness, and longer ones reduce false signals.
ATR Period (atrPeriod):
Type: Integer
Default: 14
Range: Minimum 5, Maximum 30
Purpose: Determines the period for the Average True Range (ATR) calculation, which measures volatility. Adjust this to match your trading timeframe—shorter for scalping, longer for positional trading.
These inputs allow customization without editing the code, making the indicator adaptable to different market conditions or user preferences.
Core Calculations
The MOS is computed through a series of steps, blending trend, momentum, volume, and volatility metrics. Here's a breakdown:
Multi-Timeframe Slopes:
The script fetches data from higher timeframes (5m, 15m, 30m) using request.security.
Slope calculation: For each timeframe, it computes the linear regression slope of price over the lookback period using the formula:
textslope = correlation(close, bar_index, lookback) * stdev(close, lookback) / stdev(bar_index, lookback)
This measures the rate of price change, where positive slopes indicate uptrends and negative slopes indicate downtrends.
Variables: slope5m, slope15m, slope30m.
ATR (Average True Range):
Calculated using ta.atr(atrPeriod).
Represents average volatility over the specified period. Used later to derive volatility stability.
ADX (Average Directional Index):
A detailed, manual implementation (not using built-in ta.adx for customization):
Computes upward movement (upMove = high - high ) and downward movement (downMove = low - low).
Derives +DM (Plus Directional Movement) and -DM (Minus Directional Movement) by filtering non-relevant moves.
Smooths true range (trur = ta.rma(ta.tr(true), adxPeriod)).
Calculates +DI and -DI: plusDI = 100 * ta.rma(plusDM, adxPeriod) / trur, similarly for minusDI.
DX: dx = 100 * abs(plusDI - minusDI) / max(plusDI + minusDI, 0.0001).
ADX: adx = ta.rma(dx, adxPeriod).
ADX values above 25 typically indicate strong trends; here, it's normalized (divided by 50) to influence the trend bias.
Volume Delta (5m Timeframe):
Fetches 5m volume: volume_5m = request.security(syminfo.tickerid, "5", volume, lookahead=barmerge.lookahead_on).
Computes a 12-period SMA of volume: avgVolume = ta.sma(volume_5m, 12).
Delta: (volume_5m - avgVolume) / avgVolume (or 0 if avgVolume is zero).
This measures relative volume spikes, where positive deltas suggest increased interest (bullish) and negative suggest waning activity (bearish).
MOS Components and Final Calculation:
Trend Bias: Average of the three slopes, normalized by close price and scaled by 100, then weighted by ADX influence: (slope5m + slope15m + slope30m) / 3 / close * 100 * (adx / 50).
Emphasizes trends in strong ADX conditions.
Momentum Impulse: Change in 5m RSI(14) over 1 bar, divided by 50: ta.change(request.security(syminfo.tickerid, "5", ta.rsi(close, 14), lookahead=barmerge.lookahead_on), 1) / 50.
Captures short-term momentum shifts.
Volatility Clarity: 1 - ta.change(atr, 1) / max(atr, 0.0001).
Measures ATR stability; values near 1 indicate low volatility changes (clearer trends), while lower values suggest erratic markets.
MOS Formula: Weighted average:
textmos = (0.35 * trendBias + 0.25 * momentumImpulse + 0.2 * volumeDelta + 0.2 * volatilityClarity)
Weights prioritize trend (35%) and momentum (25%), with volume and volatility at 20% each. These can be adjusted in code for experimentation.
Trading Decision:
A variable mosDecision starts as "Neutral".
If mos > 0.15, set to "Long".
If mos < -0.15, set to "Short".
Thresholds (0.15 and -0.15) are hardcoded but can be modified.
Visualization and Outputs
Threshold Lines (using hline):
Long Threshold: Horizontal dashed green line at +0.15.
Short Threshold: Horizontal dashed red line at -0.15.
Neutral Line: Horizontal dashed gray line at 0.
These provide visual reference points for MOS interpretation.
Dynamic Labels (using label.new):
Placed at each bar's index and MOS value.
Text: Formatted MOS value (e.g., "0.2345") followed by a newline and the decision (e.g., "Long").
Style: Downward-pointing label with gray background and white text for readability.
This replaces a traditional plot line, showing exact values and decisions per bar without cluttering the chart.
The indicator appears in a separate pane below the main price chart, making it easy to monitor alongside price action.
Usage Instructions
Adding to TradingView:
Copy the script into TradingView's Pine Script editor.
Save and add to your chart via the "Indicators" menu.
Select a symbol and timeframe (e.g., 1-minute for intraday).
Interpretation:
Long Signal: MOS > 0.15 – Consider bullish positions if supported by other indicators.
Short Signal: MOS < -0.15 – Potential bearish setups.
Neutral: Between -0.15 and 0.15 – Avoid trades or wait for confirmation.
Watch for MOS crossings of thresholds for momentum shifts.
Combine with price patterns, support/resistance, or volume for better accuracy.
Limitations and Considerations:
Lookahead Bias: Uses barmerge.lookahead_on for multi-timeframe data, which may introduce minor forward-looking bias in backtesting (use with caution).
No Alerts Built-In: Add custom alerts via TradingView's alert system based on MOS conditions.
Performance: Tested for compatibility; may require adjustments for illiquid assets or extreme volatility.
Backtesting: Use TradingView's strategy tester to evaluate historical performance, but remember past results don't guarantee future outcomes.
Customization: Edit weights in the MOS formula or thresholds to fit your strategy.
This indicator distills complex market data into a single score, aiding decision-making while encouraging users to verify signals with additional analysis. If you need modifications, such as restoring plot functionality or adding features, provide details for further refinement.

Futures Confluence Delta (FCD) - Histogram
The Futures Confluence Delta (FCD) Histogram is a powerful trend-following indicator tailored for scalping futures on 1-minute charts. Displayed in a bottom panel like RSI or volume, it visualizes cumulative volume delta to identify bullish or bearish market momentum. The histogram turns green for positive delta (buying pressure, suggesting a long trend) and red for negative delta (selling pressure, indicating a short trend), providing quick insight into market direction.
This indicator is ideal for futures traders seeking confluence with other tools, such as VWMA or order block strategies. It uses a simple yet effective delta calculation (buy volume for up candles, sell volume for down candles, smoothed with EMA) to highlight trend strength, making it perfect for fast-paced scalping environments.
Key Features:
Cumulative Delta Histogram: Tracks buying vs. selling pressure, smoothed with an EMA for clarity.
Color-Coded Trend Signals: Green for bullish (long) trends, red for bearish (short) trends.
Customizable Settings: Adjust the delta lookback period and enable/disable daily reset for flexibility.
Optimized for 1-minute charts on futures.
Alert Support: Set alerts for trend changes to stay ahead of market shifts.
How to Use:
Add the indicator to your 1-minute chart. Observe the histogram in the bottom panel:
Green bars (positive delta) suggest a bullish trend, favoring long entries.
Red bars (negative delta) indicate a bearish trend, favoring short entries.
Combine with other indicators (e.g., VWMA, order blocks, or FVGs) for confluence.
Set alerts for trend changes via the FCD Long Trend or FCD Short Trend conditions.
Adjust settings (delta lookback, daily reset) to match your trading style.
Settings:
Delta Lookback Period (default: 14): Controls the EMA smoothing of the delta. Lower values increase sensitivity; higher values smooth trends.
Reset Delta Daily (default: true): Resets cumulative delta at the start of each trading day for futures session alignment.
Long Color (default: green): Color for bullish delta.
Short Color (default: red): Color for bearish delta.
Notes:
Ensure sufficient historical data (500+ bars) for accurate delta calculations.
Test on NQ for higher volatility, as it may show stronger delta signals compared to GC or ES.
Check the Pine Logs pane (“More” > “Pine Logs”) for any NA data issues if the histogram doesn’t display.
Share your feedback or suggestions in the comments!

Delta Volume Candles [LucF]█ OVERVIEW
This indicator plots on-chart volume delta information using candles that can replace your normal candles, tops and bottoms appended to normal candles, optional MAs of those tops and bottoms levels, a divergence channel and a chart background. The indicator calculates volume delta using intrabar analysis, meaning that it uses the lower timeframe bars constituting each chart bar.
█ CONCEPTS
Volume Delta
The volume delta concept divides a bar's volume in "up" and "down" volumes. The delta is calculated by subtracting down volume from up volume. Many calculation techniques exist to isolate up and down volume within a bar. The simplest use the polarity of interbar price changes to assign their volume to up or down slots, e.g., On Balance Volume or the Klinger Oscillator . Others such as Chaikin Money Flow use assumptions based on a bar's OHLC values. The most precise calculation method uses tick data and assigns the volume of each tick to the up or down slot depending on whether the transaction occurs at the bid or ask price. While this technique is ideal, it requires huge amounts of data on historical bars, which considerably limits the historical depth of charts and the number of symbols for which tick data is available. Furthermore, historical tick data is not yet available on TradingView.
This indicator uses intrabar analysis to achieve a compromise between the simplest and most precise methods of calculating volume delta. It is currently the most precise method usable on TradingView charts. TradingView's Volume Profile built-in indicators use it, as do the CVD - Cumulative Volume Delta Candles and CVD - Cumulative Volume Delta (Chart) indicators published from the TradingView account . My Delta Volume Channels and Volume Delta Columns Pro indicators also use intrabar analysis. Other volume delta indicators such as my Realtime 5D Profile use realtime chart updates to calculate volume delta without intrabar analysis, but that type of indicator only works in real time; they cannot calculate on historical bars.
This is the logic I use to determine the polarity of intrabars, which determines the up or down slot where its volume is added:
• If the intrabar's open and close values are different, their relative position is used.
• If the intrabar's open and close values are the same, the difference between the intrabar's close and the previous intrabar's close is used.
• As a last resort, when there is no movement during an intrabar, and it closes at the same price as the previous intrabar, the last known polarity is used.
Once all intrabars making up a chart bar have been analyzed and the up or down property of each intrabar's volume determined, the up volumes are added, and the down volumes subtracted. The resulting value is volume delta for that chart bar, which can be used as an estimate of the buying/selling pressure on an instrument. Not all markets have volume information. Without it, this indicator is useless.
Intrabar analysis
Intrabars are chart bars at a lower timeframe than the chart's. The timeframe used to access intrabars determines the number of intrabars accessible for each chart bar. On a 1H chart, each chart bar of an active market will, for example, usually contain 60 bars at the lower timeframe of 1min, provided there was market activity during each minute of the hour.
This indicator automatically calculates an appropriate lower timeframe using the chart's timeframe and the settings you use in the script's "Intrabars" section of the inputs. As it can access lower timeframes as small as seconds when available, the indicator can be used on charts at relatively small timeframes such as 1min, provided the market is active enough to produce bars at second timeframes.
The quantity of intrabars analyzed in each chart bar determines:
• The precision of calculations (more intrabars yield more precise results).
• The chart coverage of calculations (there is a 100K limit to the quantity of intrabars that can be analyzed on any chart,
so the more intrabars you analyze per chart bar, the less chart bars can be calculated by the indicator).
The information box displayed at the bottom right of the chart shows the lower timeframe used for intrabars, as well as the average number of intrabars detected for chart bars and statistics on chart coverage.
Balances
This indicator calculates five balances from volume delta values. The balances are oscillators with a zero centerline; positive values are bullish, and negative values are bearish. It is important to understand the balances as they can be used to:
• Color candle bodies.
• Calculate body and top and bottom divergences.
• Color an EMA channel.
• Color the chart's background.
• Configure markers and alerts.
The five balances are:
1 — Bar Balance : This is the only balance using instant values; it is simply the subtraction of the down volume from the up volume on the bar, so the instant volume delta for that bar.
2 — Average Balance : Calculates a distinct EMA for both the up and down volumes, and subtracts the down EMA from the up EMA.
The result is akin to MACD's histogram because it is the subtraction of two moving averages.
3 — Momentum Balance : Starts by calculating, separately for both up and down volumes, the difference between the same EMAs used in "Average Balance" and
an SMA of twice the period used for the "Average Balance" EMAs. The difference for the up side is subtracted from the difference for the down side,
and an RSI of that value is calculated and brought over the −50/+50 scale.
4 — Relative Balance : The reference values used in the calculation are the up and down EMAs used in the "Average Balance".
From those, we calculate two intermediate values using how much the instant up and down volumes on the bar exceed their respective EMA — but with a twist.
If the bar's up volume does not exceed the EMA of up volume, a zero value is used. The same goes for the down volume with the EMA of down volume.
Once we have our two intermediate values for the up and down volumes exceeding their respective MA, we subtract them. The final value is an ALMA of that subtraction.
The rationale behind using zero values when the bar's up/down volume does not exceed its EMA is to only take into account the more significant volume.
If both instant volume values exceed their MA, then the difference between the two is the signal's value.
The signal is called "relative" because the intermediate values are the difference between the instant up/down volumes and their respective MA.
This balance flatlines when the bar's up/down volumes do not exceed their EMAs, which makes it useful to spot areas where trader interest dwindles, such as consolidations.
The smaller the period of the final value's ALMA, the more easily it will flatline. These flat zones should be considered no-trade zones.
5 — Percent Balance : This balance is the ALMA of the ratio of the "Bar Balance" over the total volume for that bar.
From the balances and marker conditions, two more values are calculated:
1 — Marker Bias : This sums the up/down (+1/‒1) occurrences of the markers 1 to 4 over a period you define, so it ranges from −4 to +4, times the period.
Its calculation will depend on the modes used to calculate markers 3 and 4.
2 — Combined Balances : This is the sum of the bull/bear (+1/−1) states of each of the five balances, so it ranges from −5 to +5.
The periods for all of these balances can be configured in the "Periods" section at the bottom of the script's inputs. As you cannot see the balances on the chart, you can use my Volume Delta Columns Pro indicator in a pane; it can plot the same balances, so you will be able to analyze them.
Divergences
In the context of this indicator, a divergence is any bar where the bear/bull state of a balance (above/below its zero centerline) diverges from the polarity of a chart bar. No directional bias is assigned to divergences when they occur. Candle bodies and tops/bottoms can each be colored differently on divergences detected from distinct balances.
Divergence Channel
The divergence channel is the space between two levels (by default, the bar's open and close ) saved when divergences occur. When price (by default the close ) has breached a channel and a new divergence occurs, a new channel is created. Until that new channel is breached, bars where additional divergences occur will expand the channel's levels if the bar's price points are outside the channel.
Prices breaches of the divergence channel will change its state. Divergence channels can be in one of three different states:
• Bull (green): Price has breached the channel to the upside.
• Bear (red): Price has breached the channel to the downside.
• Neutral (gray): The channel has not yet been breached.
█ HOW TO USE THE INDICATOR
I do not make videos to explain how to use my indicators. I do, however, try hard to include in their description everything one needs to understand what they do. From there, it's up to you to explore and figure out if they can be useful in your trading practice. Communicating in videos what this description and the script's tooltips contain would make for very long videos that would likely exceed the attention span of most people who find this description too long. There is no quick way to understand an indicator such as this one because it uses many different concepts and has quite a bit of settings one can use to modify its visuals and behavior — thus how one uses it. I will happily answer questions on the inner workings of the indicator, but I do not answer questions like "How do I trade using this indicator?" A useful answer to that question would require an in-depth analysis of who you are, your trading methodology and objectives, which I do not have time for. I do not teach trading.
Start by loading the indicator on an active chart containing volume information. See here if you need help.
The default configuration displays:
• Normal candles where the bodies are only colored if the bar's volume has increased since the last bar.
If you want to use this indicator's candles, you may want to disable your chart's candles by clicking the eye icon to the right of the symbol's name in the top left of the chart.
• A top or bottom appended to the normal candles. It represents the difference between up and down volume for that bar
and is positioned at the top or bottom, depending on its polarity. If up volume is greater than down volume, a top is displayed. If down volume is greater, a bottom is plotted.
The size of tops and bottoms is determined by calculating a factor which is the proportion of volume delta over the bar's total volume.
That factor is then used to calculate the top or bottom size relative to a baseline of the average candle body size of the last 100 bars.
• An information box in the bottom right displaying intrabar and chart coverage information.
• A light red background when the intrabar volume differs from the chart's volume by more than 1%.
The script's inputs contain tooltips explaining most of the fields. I will not repeat them here. Following is a brief description of each section of the indicator's inputs which will give you an idea of what the indicator can do:
Normal Candles is where you configure the replacement candles plotted by the script. You can choose from different coloring schemes for their bodies and specify a unique color for bodies where a divergence calculated using the method you choose occurs.
Volume Tops & Botttoms is where you configure the display of tops and bottoms, and their EMAs. The EMAs are calculated from the high point of tops and the low point of bottoms. They can act as a channel to evaluate price, and you can choose to color the channel using a gradient reflecting the advances/declines in the balance of your choice.
Divergence Channel is where you set up the appearance and behavior of the divergence channel. These areas represent levels where price and volume delta information do not converge. They can be interpreted as regions with no clear direction from where one will look for breaches. You can configure the channel to take into account one or both types of divergences you have configured for candle bodies and tops/bottoms.
Background allows you to configure a gradient background color that reflects the advances/declines in the balance of your choice. You can use this to provide context to the volume delta values from bars. You can also control the background color displayed on volume discrepancies between the intrabar and the chart's timeframe.
Intrabars is where you choose the calculation mode determining the lower timeframe used to access intrabars. The indicator uses the chart's timeframe and the type of market you are on to calculate the lower timeframe. Your setting there should reflect which compromise you prefer between the precision of calculations and chart coverage. This is also where you control the display of the information box in the lower right corner of the chart.
Markers allows you to control the plotting of chart markers on different conditions. Their configuration determines when alerts generated from the indicator will fire. Note that in order to generate alerts from this script, they must be created from your chart. See this Help Center page to learn how. Only the last 500 markers will be visible on the chart, but this will not affect the generation of alerts.
Periods is where you configure the periods for the balances and the EMAs used in the indicator.
The raw values calculated by this script can be inspected using the Data Window.
█ INTERPRETATION
Rightly or wrongly, volume delta is considered by many a useful complement to the interpretation of price action. I use it extensively in an attempt to find convergence between my read of volume delta and price movement — not so much as a predictor of future price movement. No system or person can predict the future. Accordingly, I consider people who speak or act as if they know the future with certainty to be dangerous to themselves and others; they are charlatans, imprudent or blissfully ignorant.
I try to avoid elaborate volume delta interpretation schemes involving too many variables and prefer to keep things simple:
• Trends that have more chances of continuing should be accompanied by VD of the same polarity.
In trends, I am looking for "slow and steady". I work from the assumption that traders and systems often overreact, which translates into unproductive volatility.
Wild trends are more susceptible to overreactions.
• I prefer steady VD values over wildly increasing ones, as large VD increases often come with increased price volatility, which can backfire.
Large VD values caused by stopping volume will also often occur on trend reversals with abnormally high candles.
• Prices escaping divergence channels may be leading a trend in that direction, although there is no telling how long that trend will last; could be just a few bars or hundreds.
When price is in a channel, shifts in VD balances can sometimes give us an idea of the direction where price has the most chance of breaking.
• Dwindling VD will often indicate trend exhaustion and predate reversals by many bars, but the problem is that mere pauses in a trend will often produce the same behavior in VD.
I think it is too perilous to infer rigidly from VD decreases.
Divergence Channel
Here I have configured the divergence channels to be visible. First, I set the bodies to display divergences on the default Bar Balance. They are indicated by yellow bodies. Then I activated the divergence channels by choosing to draw levels on body divergences and checked the "Fill" checkbox to fill the channel with the same color as the levels. The divergence channel is best understood as a direction-less area from where a breach can be acted on if other variables converge with the breach's direction:
Tops and Bottoms EMAs
I find these EMAs rather interesting. They have no equivalent elsewhere, as they are calculated from the top and bottom values this indicator plots. The only similarity they have with volume-weighted MAs, including VWAP, is that they use price and volume. This indicator's Tops and Bottoms EMAs, however, use the price and volume delta. While the channel differs from other channels in how it is calculated, it can be used like others, as a baseline from which to evaluate price movement or, alternatively, as stop levels. Remember that you can change the period used for the EMAs in the "Periods" section of the inputs.
This chart shows the EMAs in action, filled with a gradient representing the advances/decline from the Momentum balance. Notice the anomaly in the chart's latest bars where the Momentum balance gradient has been indicating a bullish bias for some time, during which price was mostly below the EMAs. Price has just broken above the channel on positive VD. My interpretation of this situation would be that it is a risky opportunity for a long trade in the larger context where the market has been in a downtrend since the 5th. Intrepid traders choosing to enter here could do so with a "make or break" tight stop that will minimize their losses should the market continue its downtrend while hopefully preserving the potential upside of price continuing on the longer-term uptrend prevalent since the 28th:
█ NOTES
Volume
If you use indicators such as this one which depends on volume information, it is important to realize that the volume data they consume comes from data feeds, and that all data feeds are NOT created equally. Those who create the data feeds we use must make decisions concerning the nature of the transactions they tally and the way they are tallied in each feed, and these decisions affect the nature of our volume data. My Volume X-ray publication discusses some of the reasons why volume information from different timeframes, brokers/exchanges or sectors may vary considerably. I encourage you to read it. This indicator's display of a warning through a background color on volume discrepancies between the timeframe used to access intrabars and the chart's timeframe is an attempt to help you realize these variations in feeds. Don't take things for granted, and understand that the quality of a given feed's volume information affects the quality of the results this indicator calculates.
Markets as ecosystems
I believe it is perilous to think that behavioral patterns you discover in one market through the lens of this or any other indicator will necessarily port to other markets. While this may sometimes be the case, it will often not. Why is that? Because each market is its own ecosystem. As cities do, all markets share some common characteristics, but they also all have their idiosyncrasies. A proportion of a city's inhabitants is always composed of outsiders who come and go, but a core population of regulars and systems is usually the force that actually defines most of the city's observable characteristics. I believe markets work somewhat the same way; they may look the same, but if you live there for a while and pay attention, you will notice the idiosyncrasies. Some things that work in some markets will, accordingly, not work in others. Please keep that in mind when you draw conclusions.
On Up/Down or Buy/Sell Volume
Buying or selling volume are misnomers, as every unit of volume transacted is both bought and sold by two different traders. While this does not keep me from using the terms, there is no such thing as “buy only” or “sell only” volume. Trader lingo is riddled with peculiarities. Without access to order book information, traders work with the assumption that when price moves up during a bar, there was more buying pressure than selling pressure, just as when buy market orders take out limit ask orders in the order book at successively higher levels. The built-in volume indicator available on TradingView uses this logic to color the volume columns green or red. While this script’s calculations are more precise because it analyses intrabars to calculate its information, it uses pretty much the same imperfect logic. Until Pine scripts can have access to how much volume was transacted at the bid/ask prices, our volume delta calculations will remain a mere proxy.
Repainting
• The values calculated on the realtime bar will update as new information comes from the feed.
• Historical values may recalculate if the historical feed is updated or when calculations start from a new point in history.
• Markers and alerts will not repaint as they only occur on a bar's close. Keep this in mind when viewing markers on historical bars,
where one could understandably and incorrectly assume they appear at the bar's open.
To learn more about repainting, see the Pine Script™ User Manual's page on the subject .
Superfluity
In "The Bed of Procrustes", Nassim Nicholas Taleb writes: To bankrupt a fool, give him information . This indicator can display a lot of information. The inevitable adaptation period you will need to figure out how to use it should help you eliminate all the visuals you do not need. The more you eliminate, the easier it will be to focus on those that are the most useful to your trading practice. Don't be a fool.
█ THANKS
Thanks to alexgrover for his Dekidaka-Ashi indicator. His volume plots on candles were the inspiration for my top/bottom plots.
Kudos to PineCoders for their libraries. I use two of them in this script: Time and lower_tf .
The first versions of this script used functionality that I would not have known about were it not for these two guys:
— A guy called Kuan who commented on a Backtest Rookies presentation of their Volume Profile indicator.
— theheirophant , my partner in the exploration of the sometimes weird abysses of request.security() ’s behavior at lower timeframes.

Logarithmic CVD [IkkeOmar]The LCVD is another Mean-Reversion Indicator. it doesn't detect trends and does not give a signal per se. However the logarithmic transformation is made to visualize the direction of the trend for the volume. This allows you to see if money is flowing in or out of an asset.
What it does is tell you if we have a flashcrash based on the difference in volume.
Think of this indicator like a form of a volatility index.
Smoothing input:
The only input is an input for the smoothing length of the logDelta.
Volume Calculation:
// @IkkeOmar
//@version=5
indicator('Logarithmic CVD', shorttitle='CVD', overlay=false)
smooth = input.int(defval = 25, title = "Smoothing Distance")
// Calculate buying and selling volume
askVolume = volume * (close > open ? 1 : 0) // Assuming higher close than open indicates buying
bidVolume = volume * (close < open ? 1 : 0) // Assuming lower close than open indicates selling
// Delta is the difference between buying and selling volume
delta = askVolume - bidVolume
// Apply logarithmic transformation to delta
// Adding a check to ensure delta is not zero as log(0) is undefined
logDelta = delta > 0 ? math.log(math.abs(delta)) * math.sign(delta) : - math.log(math.abs(delta)) * math.sign(delta)
// use the the ta lib for calculating the sma of the logDelta
smoothLogDelta = ta.sma(logDelta, smooth)
// Create candlestick plot
plot(logDelta, color= color.green, title='Logarithmic CVD')
plot(smoothLogDelta, color= color.rgb(145, 37, 1), title='Smooth CVD')
These lines calculate the buying and selling volumes. askVolume is calculated as the total volume when the closing price is higher than the opening price, assuming this indicates buying pressure. bidVolume is calculated as the total volume when the closing price is lower than the opening price, assuming selling pressure.
The Delta is simply the difference between buying and selling volumes.
Logarithmic Transformation:
logDelta = delta > 0 ? math.log(math.abs(delta)) * math.sign(delta) : - math.log(math.abs(delta)) * math.sign(delta)
Applies a logarithmic transformation to delta. The math.log function is used to calculate the natural logarithm of the absolute value of delta. The sign of delta is preserved to differentiate between positive and negative values. This transformation helps in scaling the delta values, especially useful when dealing with large numbers.
This script essentially provides a visual representation of the buying and selling pressures in a market, transformed logarithmically for better scaling and smoothed for trend analysis.
Hope it makes sense!
Stay safe everyone!
Don't hesitate to ask any questions if you have any!

Nef33-Volume Footprint ApproximationDescription of the "Volume Footprint Approximation" Indicator
Purpose
The "Volume Footprint Approximation" indicator is a tool designed to assist traders in analyzing market volume dynamics and anticipating potential trend changes in price. It is inspired by the concept of a volume footprint chart, which visualizes the distribution of trading volume across different price levels. However, since TradingView does not provide detailed intrabar data for all users, this indicator approximates the behavior of a footprint chart by using available volume and price data (open, close, volume) to classify volume as buy or sell, calculate volume delta, detect imbalances, and generate trend change signals.
The indicator is particularly useful for identifying areas of high buying or selling activity, imbalances between supply and demand, delta divergences, and potential reversal points in the market. It provides specific signals for bullish and bearish trend changes, making it suitable for traders looking to trade reversals or confirm trends.
How It Works
The indicator uses volume and price data from each candlestick to perform the following calculations:
Volume Classification:
Classifies the volume of each candlestick as "buy" or "sell" based on price movement:
If the closing price is higher than the opening price (close > open), the volume is classified as "buy."
If the closing price is lower than the opening price (close < open), the volume is classified as "sell."
If the closing price equals the opening price (close == open), it compares with the previous close to determine the direction:
If the current close is higher than the previous close, it is classified as "buy."
If the current close is lower than the previous close, it is classified as "sell."
If the current close equals the previous close, the classification from the previous bar is used.
Delta Calculation:
Calculates the volume delta as the difference between buy volume and sell volume (buyVolume - sellVolume).
A positive delta indicates more buy volume; a negative delta indicates more sell volume.
Imbalance Detection:
Identifies imbalances between buy and sell volume:
A buy imbalance occurs when buy volume exceeds sell volume by a defined percentage (default is 300%).
A sell imbalance occurs when sell volume exceeds buy volume by the same percentage.
Delta Divergence Detection:
Positive Delta Divergence: Occurs when the price is falling (for at least 2 bars) but the delta is increasing or becomes positive, indicating that buyers are entering despite the price decline.
Negative Delta Divergence: Occurs when the price is rising (for at least 2 bars) but the delta is decreasing or becomes negative, indicating that sellers are entering despite the price increase.
Trend Change Signals:
Bullish Signal (trendChangeBullish): Generated when the following conditions are met:
There is a positive delta divergence.
The delta has moved from a negative value (e.g., -500) to a positive value (e.g., +200) over the last 3 bars.
There is a buy imbalance.
The price is near a historical support level (approximated as the lowest low of the last 50 bars).
Bearish Signal (trendChangeBearish): Generated when the following conditions are met:
There is a negative delta divergence.
The delta has moved from a positive value (e.g., +500) to a negative value (e.g., -200) over the last 3 bars.
There is a sell imbalance.
The price is near a historical resistance level (approximated as the highest high of the last 50 bars).
Visual Elements
The indicator is displayed in a separate panel below the price chart (overlay=false) and includes the following elements:
Volume Histograms:
Buy Volume: Represented by a green histogram. Shows the volume classified as "buy."
Sell Volume: Represented by a red histogram. Shows the volume classified as "sell."
Note: The histograms overlap, and the last plotted histogram (red) takes visual precedence, meaning the sell volume may cover the buy volume if it is larger.
Delta Line:
Delta Volume: Represented by a blue line. Shows the difference between buy and sell volume.
A line above zero indicates more buy volume; a line below zero indicates more sell volume.
A dashed gray horizontal line marks the zero level for easier interpretation.
Imbalance Backgrounds:
Buy Imbalance: Light green background when buy volume exceeds sell volume by the defined percentage.
Sell Imbalance: Light red background when sell volume exceeds buy volume by the defined percentage.
Divergence Backgrounds:
Positive Delta Divergence: Lime green background when a positive delta divergence is detected.
Negative Delta Divergence: Fuchsia background when a negative delta divergence is detected.
Trend Change Signals:
Bullish Signal: Green label with the text "Bullish Trend Change" when the conditions for a bullish trend change are met.
Bearish Signal: Red label with the text "Bearish Trend Change" when the conditions for a bearish trend change are met.
Information Labels:
Below each bar, a label displays:
Total Vol: The total volume of the bar.
Delta: The delta volume value.
Alerts
The indicator generates the following alerts:
Positive Delta Divergence: "Positive Delta Divergence Detected! Price is falling, but delta is increasing."
Negative Delta Divergence: "Negative Delta Divergence Detected! Price is rising, but delta is decreasing."
Bullish Trend Change Signal: "Bullish Trend Change Signal! Positive Delta Divergence, Delta Rise, Buy Imbalance, and Near Support."
Bearish Trend Change Signal: "Bearish Trend Change Signal! Negative Delta Divergence, Delta Drop, Sell Imbalance, and Near Resistance."
These alerts can be configured in TradingView to receive real-time notifications.
Adjustable Parameters
The indicator allows customization of the following parameters:
Imbalance Threshold (%): The percentage required to detect an imbalance between buy and sell volume (default is 300%).
Lookback Period for Divergence: Number of bars to look back for detecting price and delta trends (default is 2 bars).
Support/Resistance Lookback Period: Number of bars to look back for identifying historical support and resistance levels (default is 50 bars).
Delta High Threshold (Bearish): Minimum delta value 2 bars ago for the bearish signal (default is +500).
Delta Low Threshold (Bearish): Maximum delta value in the current bar for the bearish signal (default is -200).
Delta Low Threshold (Bullish): Maximum delta value 2 bars ago for the bullish signal (default is -500).
Delta High Threshold (Bullish): Minimum delta value in the current bar for the bullish signal (default is +200).
Practical Use
The indicator is useful for the following purposes:
Identifying Trend Changes:
The trend change signals (trendChangeBullish and trendChangeBearish) indicate potential price reversals. For example, a bullish signal near a support level may be an opportunity to enter a long position.
Detecting Divergences:
Delta divergences (positive and negative) can anticipate trend changes by showing a disagreement between price movement and underlying buying/selling pressure.
Finding Key Levels:
Imbalances (green and red backgrounds) often coincide with support and resistance levels, helping to identify areas where the market might react.
Confirming Trends:
A consistently positive delta in an uptrend or a negative delta in a downtrend can confirm the strength of the trend.
Identifying Failed Auctions:
Although not detected automatically, you can manually identify failed auctions by observing a price move to new highs/lows with decreasing volume in the direction of the move.
Limitations
Intrabar Data: It does not use detailed intrabar data, making it less precise than a native footprint chart.
Approximations: Volume classification and support/resistance detection are approximations, which may lead to false signals.
Volume Dependency: It requires reliable volume data, so it may be less effective on assets with inaccurate volume data (e.g., some forex pairs).
False Signals: Divergences and imbalances do not always indicate a trend change, especially in strongly trending markets.
Recommendations
Combine with Other Indicators: Use tools like RSI, MACD, support/resistance levels, or candlestick patterns to confirm signals.
Trade on Higher Timeframes: Signals are more reliable on higher timeframes like 1-hour or 4-hour charts.
Perform Backtesting: Evaluate the indicator's accuracy on historical data to adjust parameters and improve effectiveness.
Adjust Parameters: Modify thresholds (e.g., imbalanceThreshold or supportResistanceLookback) based on the asset and timeframe you are trading.
Conclusion
The "Volume Footprint Approximation" indicator is a powerful tool for analyzing volume dynamics and anticipating price trend changes. By classifying volume, calculating delta, detecting imbalances and divergences, and generating trend change signals, it provides traders with valuable insights into market buying and selling pressure. While it has limitations due to the lack of intrabar data, it can be highly effective when used in combination with other technical analysis tools and on assets with reliable volume data.

Delta Volume Channels [LucF]█ OVERVIEW
This indicator displays on-chart visuals aimed at making the most of delta volume information. It can color bars and display two channels: one for delta volume, another calculated from the price levels of bars where delta volume divergences occur. Markers and alerts can also be configured using key conditions, and filtered in many different ways. The indicator caters to traders who prefer chart visuals over raw values. It will work on historical bars and in real time, using intrabar analysis to calculate delta volume in both conditions.
█ CONCEPTS
Delta Volume
The volume delta concept divides a bar's volume in "up" and "down" volumes. The delta is calculated by subtracting down volume from up volume. Many calculation techniques exist to isolate up and down volume within a bar. The simplest techniques use the polarity of interbar price changes to assign their volume to up or down slots, e.g., On Balance Volume or the Klinger Oscillator . Others such as Chaikin Money Flow use assumptions based on a bar's OHLC values. The most precise calculation method uses tick data and assigns the volume of each tick to the up or down slot depending on whether the transaction occurs at the bid or ask price. While this technique is ideal, it requires huge amounts of data on historical bars, which usually limits the historical depth of charts and the number of symbols for which tick data is available.
This indicator uses intrabar analysis to achieve a compromise between the simplest and most precise methods of calculating volume delta. In the context where historical tick data is not yet available on TradingView, intrabar analysis is the most precise technique to calculate volume delta on historical bars on our charts. TradingView's Volume Profile built-in indicators use it, as do the CVD - Cumulative Volume Delta Candles and CVD - Cumulative Volume Delta (Chart) indicators published from the TradingView account . My Volume Delta Columns Pro indicator also uses intrabar analysis. Other volume delta indicators such as my Realtime 5D Profile use realtime chart updates to achieve more precise volume delta calculations. Indicators of that type cannot be used on historical bars however; they only work in real time.
This is the logic I use to assign intrabar volume to up or down slots:
• If the intrabar's open and close values are different, their relative position is used.
• If the intrabar's open and close values are the same, the difference between the intrabar's close and the previous intrabar's close is used.
• As a last resort, when there is no movement during an intrabar and it closes at the same price as the previous intrabar, the last known polarity is used.
Once all intrabars making up a chart bar have been analyzed and the up or down property of each intrabar's volume determined, the up volumes are added and the down volumes subtracted. The resulting value is volume delta for that chart bar, which can be used as an estimate of the buying/selling pressure on an instrument.
Delta Volume Percent (DV%)
This value is the proportion that delta volume represents of the total intrabar volume in the chart bar. Note that on some symbols/timeframes, the total intrabar volume may differ from the chart's volume for a bar, but that will not affect our calculations since we use the total intrabar volume.
Delta Volume Channel
The DV channel is the space between two moving averages: the reference line and a DV%-weighted version of that reference. The reference line is a moving average of a type, source and length which you select. The DV%-weighted line uses the same settings, but it averages the DV%-weighted price source.
The weight applied to the source of the reference line is calculated from two values, which are multiplied: DV% and the relative size of the bar's volume in relation to previous bars. The effect of this is that DV% values on bars with higher total volume will carry greater weight than those with lesser volume.
The DV channel can be in one of four states, each having its corresponding color:
• Bull (teal): The DV%-weighted line is above the reference line.
• Strong bull (lime): The bull condition is fulfilled and the bar's close is above the reference line and both the reference and the DV%-weighted lines are rising.
• Bear (maroon): The DV%-weighted line is below the reference line.
• Strong bear (pink): The bear condition is fulfilled and the bar's close is below the reference line and both the reference and the DV%-weighted lines are falling.
Divergences
In the context of this indicator, a divergence is any bar where the slope of the reference line does not match that of the DV%-weighted line. No directional bias is assigned to divergences when they occur.
Divergence Channel
The divergence channel is the space between two levels (by default, the bar's low and high ) saved when divergences occur. When price has breached a channel and a new divergence occurs, a new channel is created. Until that new channel is breached, bars where additional divergences occur will expand the channel's levels if the bar's price points are outside the channel.
Prices breaches of the divergence channel will change its state. Divergence channels can be in one of five different states:
• Bull (teal): Price has breached the channel to the upside.
• Strong bull (lime): The bull condition is fulfilled and the DV channel is in the strong bull state.
• Bear (maroon): Price has breached the channel to the downside.
• Strong bear (pink): The bear condition is fulfilled and the DV channel is in the strong bear state.
• Neutral (gray): The channel has not been breached.
█ HOW TO USE THE INDICATOR
Load the indicator on an active chart (see here if you don't know how).
The default configuration displays:
• The DV channel, without the reference or DV%-weighted lines.
• The Divergence channel, without its level lines.
• Bar colors using the state of the DV channel.
The default settings use an Arnaud-Legoux moving average on the close and a length of 20 bars. The DV%-weighted version of it uses a combination of DV% and relative volume to calculate the ultimate weight applied to the reference. The DV%-weighted line is capped to 5 standard deviations of the reference. The lower timeframe used to access intrabars automatically adjusts to the chart's timeframe and achieves optimal balance between the number of intrabars inspected in each chart bar, and the number of chart bars covered by the script's calculations.
The Divergence channel's levels are determined using the high and low of the bars where divergences occur. Breaches of the channel require a bar's low to move above the top of the channel, and the bar's high to move below the channel's bottom.
No markers appear on the chart; if you want to create alerts from this script, you will need first to define the conditions that will trigger the markers, then create the alert, which will trigger on those same conditions.
To learn more about how to use this indicator, you must understand the concepts it uses and the information it displays, which requires reading this description. There are no videos to explain it.
█ FEATURES
The script's inputs are divided in four sections: "DV channel", "Divergence channel", "Other Visuals" and "Marker/Alert Conditions". The first setting is the selection method used to determine the intrabar precision, i.e., how many lower timeframe bars (intrabars) are examined in each chart bar. The more intrabars you analyze, the more precise the calculation of DV% results will be, but the less chart coverage can be covered by the script's calculations.
DV Channel
Here, you control the visibility and colors of the reference line, its weighted version, and the DV channel between them.
You also specify what type of moving average you want to use as a reference line, its source and length. This acts as the DV channel's baseline. The DV%-weighted line is also a moving average of the same type and length as the reference line, except that it will be calculated from the DV%-weighted source used in the reference line. By default, the DV%-weighted line is capped to five standard deviations of the reference line. You can change that value here. This section is also where you can disable the relative volume component of the weight.
Divergence Channel
This is where you control the appearance of the divergence channel and the key price values used in determining the channel's levels and breaching conditions. These choices have an impact on the behavior of the channel. More generous level prices like the default low and high selection will produce more conservative channels, as will the default choice for breach prices.
In this section, you can also enable a mode where an attempt is made to estimate the channel's bias before price breaches the channel. When it is enabled, successive increases/decreases of the channel's top and bottom levels are counted as new divergences occur. When one count is greater than the other, a bull/bear bias is inferred from it.
Other Visuals
You specify here:
• The method used to color chart bars, if you choose to do so.
• The display of a mark appearing above or below bars when a divergence occurs.
• If you want raw values to appear in tooltips when you hover above chart bars. The default setting does not display them, which makes the script faster.
• If you want to display an information box which by default appears in the lower left of the chart.
It shows which lower timeframe is used for intrabars, and the average number of intrabars per chart bar.
Marker/Alert Conditions
Here, you specify the conditions that will trigger up or down markers. The trigger conditions can include a combination of state transitions of the DV and the divergence channels. The triggering conditions can be filtered using a variety of conditions.
Configuring the marker conditions is necessary before creating an alert from this script, as the alert will use the marker conditions to trigger.
Markers only appear on bar closes, so they will not repaint. Keep in mind, when looking at markers on historical bars, that they are positioned on the bar when it closes — NOT when it opens.
Raw values
The raw values calculated by this script can be inspected using a tooltip and the Data Window. The tooltip is visible when you hover over the top of chart bars. It will display on the last 500 bars of the chart, and shows the values of DV, DV%, the combined weight, and the intermediary values used to calculate them.
█ INTERPRETATION
The aim of the DV channel is to provide a visual representation of the buying/selling pressure calculated using delta volume. The simplest characteristic of the channel is its bull/bear state. One can then distinguish between its bull and strong bull states, as transitions from strong bull to bull states will generally happen when buyers are losing steam. While one should not infer a reversal from such transitions, they can be a good place to tighten stops. Only time will tell if a reversal will occur. One or more divergences will often occur before reversals.
The nature of the divergence channel's design makes it particularly adept at identifying consolidation areas if its settings are kept on the conservative side. A gray divergence channel should usually be considered a no-trade zone. More adventurous traders can use the DV channel to orient their trade entries if they accept the risk of trading in a neutral divergence channel, which by definition will not have been breached by price.
If your charts are already busy with other stuff you want to hold on to, you could consider using only the chart bar coloring component of this indicator:
At its simplest, one way to use this indicator would be to look for overlaps of the strong bull/bear colors in both the DV channel and a divergence channel, as these identify points where price is breaching the divergence channel when buy/sell pressure is consistent with the direction of the breach. I have highlighted all those points in the chart below. Not all of them would have produced profitable trades, but nothing is perfect in the markets. Also, keep in mind that the circles identify the visual you would be looking for — not the trade's entry level.
█ LIMITATIONS
• The script will not work on symbols where no volume is available. An error will appear when that is the case.
• Because a maximum of 100K intrabars can be analyzed by a script, a compromise is necessary between the number of intrabars analyzed per chart bar
and chart coverage. The more intrabars you analyze per chart bar, the less coverage you will obtain.
The setting of the "Intrabar precision" field in the "DV channel" section of the script's inputs
is where you control how the lower timeframe is calculated from the chart's timeframe.
█ NOTES
Volume Quality
If you use volume, it's important to understand its nature and quality, as it varies with sectors and instruments. My Volume X-ray indicator is one way you can appraise the quality of an instrument's intraday volume.
For Pine Script™ Coders
• This script uses the new overload of the fill() function which now makes it possible to do vertical gradients in Pine. I use it for both channels displayed by this script.
• I use the new arguments for plot() 's `display` parameter to control where the script plots some of its values,
namely those I only want to appear in the script's status line and in the Data Window.
• I wrote my script using the revised recommendations in the Style Guide from the Pine v5 User Manual.
█ THANKS
To PineCoders . I have used their lower_tf library in this script, to manage the calculation of the LTF and intrabar stats, and their Time library to convert a timeframe in seconds to a printable form for its display in the Information box.
To TradingView's Pine Script™ team. Their innovations and improvements, big and small, constantly expand the boundaries of the language. What this script does would not have been possible just a few months back.
And finally, thanks to all the users of my scripts who take the time to comment on my publications and suggest improvements. I do not reply to all but I do read your comments and do my best to implement your suggestions with the limited time that I have.

Bollinger Bands Delta Matrix Analytics [BDMA] Bollinger Bands Delta Matrix Analytics (BDMA) v7.0
Deep Kinetic Engine – 5x8 Volatility & Delta Decision Matrix
1. Introduction & Concept
Bollinger Bands Delta Matrix Analytics (BDMA) v7.0 is an analytical framework that merges:
- Spatial analysis via Bollinger Bands (%B location),
- with a 4-factor Deep Kinetic Engine based on:
• Total Volume
• Buy Volume
• Sell Volume
• Delta (Buy – Sell) Z-Scores
and converts them into an expanded 5×8 decision matrix that continuously tracks where price is trading and how the underlying orderflow is behaving.
BDMA is not a trading system or strategy. It does not generate entry/exit signals.
Instead, it provides a structured contextual map of volatility, volume, and delta so traders can:
- identify climactic extensions vs. fakeouts,
- distinguish strong initiative moves vs. passive absorption,
- and detect squeezes, traps, and liquidity voids with a unified visual dashboard.
2. Spatial Engine – Bollinger S-States (S1–S5)
The spatial dimension of BDMA comes from classic Bollinger Bands.
Price location is expressed as Percent B (%B) and mapped into 5 spatial states (S-States):
S1 – Hyper Extension (Above Upper Band)
Price has pushed beyond the upper Bollinger Band.
Often associated with parabolic or blow-off behavior, late-stage momentum, and elevated reversal risk.
S2 – Resistance Test (Upper Zone)
Price trades in the upper Bollinger region but remains inside the bands.
Represents a sustained test of resistance, typically within an established or emerging uptrend.
S3 – Neutral Zone (Middle)
Price hovers around the mid-band.
This is the mean reversion gravity field where the market often consolidates or transitions between regimes.
S4 – Support Test (Lower Zone)
Price trades in the lower Bollinger region but inside the bands.
Represents a sustained test of support within range or downtrend structures.
S5 – Hyper Drop (Below Lower Band)
Price extends below the lower Bollinger Band.
Often aligned with panic, forced liquidations, or capitulation-type behavior, with increased snap-back risk.
These 5 S-States define the vertical axis (rows) of the BDMA matrix.
3. Deep Kinetic Engine – 4-Factor Z-Score & D-States (D1–D8)
The Deep Kinetic Engine transforms raw volume and delta into standardized Z-Scores to measure how abnormal current activity is relative to its recent history.
For each bar:
- Raw Buy Volume is estimated from the candle’s position within its range
- Raw Sell Volume is complementary to buy volume
- Raw Delta = Buy Volume – Sell Volume
- Total Volume = Buy Volume + Sell Volume
These 4 series are then normalized using a unified Z-Score lookback to produce:
1. Z_Vol_Total – overall activity and liquidity intensity
2. Z_Vol_Buy – aggression from buyers (attack)
3. Z_Vol_Sell – aggression from sellers (defense or attack)
4. Z_Delta – net victory of one side over the other
Thresholds for Extreme, Significant, and Neutral Z-Score levels are fully configurable, allowing you to tune the sensitivity of the kinetic states.
Using Z_Vol_Total and Z_Delta (plus threshold logic), BDMA assigns one of 8 Deep Kinetic states (D-States):
D1 – Climax Buy
Extreme Total Volume + Extreme Positive Delta → Buying climax or blow-off behavior.
D2 – Strong Buy
High Volume + High Positive Delta → Confirmed bullish initiative activity.
D3 – Weak Buy / Fakeout
Low Volume + High Positive Delta → Bullish delta without commitment, low-liquidity breakout risk.
D4 – Absorption / Conflict
High Volume + Neutral Delta → Aggressive two-way trade, strong absorption, war zone behavior.
D5 – Neutral
Low Volume + Neutral Delta → Low-energy environment with low conviction.
D6 – Weak Sell / Fakeout
Low Volume + High Negative Delta → Bearish delta without commitment, low-liquidity breakdown risk.
D7 – Strong Sell
High Volume + High Negative Delta → Confirmed bearish initiative activity.
D8 – Capitulation
Extreme Volume + Extreme Negative Delta → Panic selling or capitulation regime.
These 8 D-States define the horizontal axis (columns) of the BDMA matrix.
4. The 5×8 BDMA Decision Matrix
The core of BDMA is a 5×8 matrix where:
- Rows (1–5) = Spatial S-States (S1…S5)
- Columns (1–8) = Kinetic D-States (D1…D8)
Each of the 40 possible combinations (SxDy) is pre-computed and mapped to:
- a Status or Regime Title (for example: Climax Breakout, Bear Trap Spring, Capitulation Breakdown),
- a Bias (Climactic Bull, Neutral, Strong Bear, Conflict or Reversal Risk, and similar labels),
- and a Strategic Signal or Consideration (for example: High reversal risk, Wait for confirmation, Low probability zone – avoid).
Internally, BDMA resolves all 40 regimes so the current state can be displayed on the dashboard without performance overhead.
5. Key Regime Families (How to Read the Matrix)
5.1. Breakouts and Breakdowns
Climax Breakout (Top-side)
Spatial S1 with Kinetic D1 or D2
Bias: Explosive or Extreme Bull
Signal:
- Strong or climactic upside extension with abnormal bullish orderflow.
- Trend continuation is possible, but reversal risk is extremely high after blow-off phases.
Low-Conviction Breakout (Fakeout Risk)
S1 with D3 (Weak Buy, low liquidity)
Bias: Weak Bull – Caution
Signal:
- Breakout not supported by volume.
- Elevated risk of failed auction or bull trap.
Capitulation Breakdown (Bottom-side)
Spatial S5 with Kinetic D8
Bias: Climactic Bear (panic)
Signal:
- Capitulation-type selling or forced liquidations.
- Trend can still proceed, but snap-back or violent short-covering risk is high.
Initiative Breakdown vs. Weak Breakdown
- Strong, high-volume breakdown typically corresponds to D7 (Strong Sell).
- Low-volume breakdown often corresponds to D6 (Weak Sell or Fakeout) with potential for failure.
5.2. Absorption, Traps and Springs
Absorption at Resistance (Top-side conflict)
S1 or S2 with D4 (Absorption or Conflict)
Bias: Conflict – Extreme Tension
Signal:
- Heavy two-way trade near resistance.
- Potential distribution or reversal if sellers begin to dominate.
Bull Trap or Failed Auction
Typically S1 with D6 (Weak Sell breakdown behavior after a top-side attempt)
Indicates a breakout attempt that fails and reverses, often after poor liquidity structure.
Absorption at Support and Bear Trap (Spring)
S4 or S5 with D4 or D3
Bias: Conflict or Weak Bear – Reversal Risk
Signal:
- Aggressive buying into lows (spring or shakeout behavior).
- Potential bear trap if price reclaims lost territory.
5.3. Trend Phases
Strong Uptrend Phases
Typically seen when S2–S3 combine with strong bullish kinetic behavior.
Bias: Strong or Extreme Bull
Signal:
- Pullbacks into S3 or S4 with supportive kinetic states often act as trend continuation zones.
Strong Downtrend Phases
Typically seen when S3–S4 combine with strong bearish kinetic behavior.
Bias: Strong or Extreme Bear
Signal:
- Rallies into resistance with strong bearish kinetic backing may act as continuation sell zones.
5.4. Neutral, Exhaustion and Squeeze
Exhaustion or Liquidity Void
S1 or S5 with D5 (Neutral kinetics)
Bias: Neutral or Exhaustion
Signal:
- Spatial extremes without kinetic confirmation.
- Often marks the end of a move, with poor follow-through.
Choppy, Low-Activity Range
S3 with D5
Bias: Neutral
Signal:
- Low volume, low conviction market.
- Typically a low-probability environment where standing aside can be logical.
Squeeze or High-Tension Zone
S3 with D4 or tightly clustered kinetic values
Bias: Conflict or High Tension
Signal:
- Hidden battle inside a volatility contraction.
- Often precedes large directionally-biased moves.
6. Dashboard Layout & Reading Guide
When Show Dashboard is enabled, BDMA displays:
1. Title and Status Line
Name of the current regime (for example: Climax Breakout, Bear Trap Spring, Mean Reversion).
2. Bias Line
Plain-language summary of directional context such as Climactic Bull, Strong Bear, Neutral, or Conflict and Reversal Risk.
3. Signal or Strategic Notes
Concise guidance focused on risk and context, not entries. For example:
- High reversal risk – aggressive traders only
- Wait for confirmation (break or rejection)
- Low probability zone – avoid taking new positions
4. Kinetic Profile (4-Factor Z-Score)
Shows the current Z-Scores for Total Volume (Activity), Buy Volume (Attack), Sell Volume (Defense), and Delta (Net Result).
5. Matrix Heatmap (5×8)
Visual representation of S-State vs. D-State with color coding:
- Bullish clusters in a green spectrum
- Bearish clusters in a red spectrum
- Conflict or exhaustion zones in yellow, amber, or neutral tones
The dashboard can be repositioned (top right, middle right, or bottom right) and its size can be adjusted (Tiny, Small, Normal, or Large) to fit different layouts.
7. Inputs & Customization
7.1. Core Parameters (Bollinger and Z-Score)
- Bollinger Length and Standard Deviation define the spatial engine.
- Z-Score Lookback (All Factors) defines how many bars are used to normalize volume and delta.
7.2. Deep Kinetic Thresholds
- Extreme Threshold defines what is considered climactic (D1 or D8).
- Significant Threshold distinguishes strong initiative vs. weak or fakeout behavior.
- Neutral Threshold is the band within which delta is treated as neutral.
These thresholds allow you to tune the sensitivity of the kinetic classification to fit different timeframes or instruments.
7.3. Calculation Method (Volume Delta)
Geometry (Approx)
- Fast, non-repainting approach based on candle geometry.
- Suitable for most users and real-time decision-making.
Intrabar (Precise)
- Uses lower-timeframe data for more precise volume delta estimation.
- Intrabar mode can repaint and requires compatible data and plan support on the platform.
- Best used for post-analysis or research, not blind automation.
7.4. Visuals and Interface
- Toggle Bollinger Bands visibility on or off.
- Switch between Dark and Light color themes.
- Configure dashboard visibility, matrix heatmap display, position, and size.
8. Multi-Language Semantic Engine (Asia and Middle East Focus)
BDMA v7.0 includes a fully integrated multi-language layer, targeting a wide geographic user base.
Supported Languages:
English, Türkçe, Русский, 简体中文, हिन्दी, العربية, فارسی, עברית
All dashboard labels, regime titles, bias descriptions, and signal texts are dynamically translated via an internal dictionary, while semantic meaning is kept consistent across languages.
This makes BDMA suitable for multi-language communities, study groups, and educational content across different regions.
However, due to the heavy computational load of the Deep Kinetic Engine and TradingView’s strict Pine Script execution limits, it was not possible to expand support to additional languages. Adding more translation layers would significantly increase memory usage and exceed runtime constraints. For this reason, the current language set represents the maximum optimized configuration achievable without compromising performance or stability.
9. Practical Usage Notes
BDMA is most powerful when used as a contextual overlay on top of market structure (HH, HL, LH, LL), higher-timeframe trend, key levels, and your own execution framework.
Recommended usage:
- Identify the current regime (Status and Bias).
- Check whether price location (S-State) and kinetic behavior (D-State) agree with your trade idea.
- Be especially cautious in climactic and absorption or conflict zones, where volatility and risk can be elevated.
Avoid treating BDMA as an automatic green equals buy, red equals sell tool.
The real edge comes from understanding where you are in the volatility or kinetic spectrum, not from forcing signals out of the matrix.
10. Limitations & Important Warnings
BDMA does not predict the future.
It organizes current and recent data into a structured context.
Volume data quality depends on the underlying symbol, exchange, and broker feed.
Forex, crypto, indices, and stocks may all behave differently.
Intrabar mode can repaint and is sensitive to lower-timeframe data availability and your plan type.
Use it with extra caution and primarily for research.
No indicator can remove the need for clear trading rules, disciplined risk management, and psychological control.
11. Disclaimer
This script is provided strictly for educational and analytical purposes.
It is not a trading system, signal service, financial product, or investment advice.
Nothing in this indicator or its description should be interpreted as a recommendation to buy or sell any asset.
Past behavior of any indicator or market pattern does not guarantee future results.
Trading and investing involve significant risk, including the risk of losing more than your initial capital in leveraged products.
You are solely responsible for your own decisions, risk management, and results.
By using this script, you acknowledge that you understand these risks and agree that the author or authors and publisher or publishers are not liable for any loss or damage arising from its use.
